Introduction
The Malaysian mobile market comprises several operators, of which five have their own networks: CelcomDigi, Maxis, U Mobile, Unifi and Yes. Regarding mobile telecommunications, MNOs are the main player of interest for TowerCos. The objective of this report is to provide a summary of the current opportunities for TowerCos in the country as a preliminary estimate.
This report provides this summary based on the following KPIs:
- Differences in coverage by MNO: not all MNOs may have the same coverage 4G and 5G along the country. Global and regional differences may help TowerCos to properly approach MNOs.
- Degraded coverage areas: areas of the country where the network (in 4G and possibly 5G) shows degradation.
- Potential co-location opportunities: co-location agreements reduce the building, installation and maintenance costs for MNOs, while improving profitability for TowerCos and optimizing space usage and resources for everyone.
- Potential BTS opportunities in urban areas: urban areas are some of the most interesting zones for performing new deployments for MNOs.
This report is divided in two great blocks:
- Block 1, with an analysis at a global level.
- Block 2, focused on BTS opportunities in urban areas, where deployments are more adjusted and optimized.
Summary
Malaysia, the 5th largest economy in Southeast Asia, home to around 33 million people is a growing economy with a very dynamic telecommunications market. The federal character of the country and the geographical differences (with the country clearly divided between West Malaysia (in the Peninsula) and East Malaysia (in Borneo)) may impact the situation of MNOs in the country.
Three mayor players dominate the mobile market with their own networks: CelcomDigi (product of the merger of Celcom and Digi during 2022), Maxis and U Mobile. Two other MNOs, Unify and Yes, provide services with a testimonial market share (under 6% of market share combined). Several MVNOs, with a more reduced impact, are also present in the country. Only the major MNOs will be analyzed in this report.
CelcomDigi, created in 2022 after the merger of its two titular companies, leads the market with around 47% of market share. Maxis (28% of market share) and U Mobile (19% of market share) are strong competitors, making the Malaysian market a very active one.
5G in Malaysia is being deployed under a single wholesale network managed by the Digital Nasional Berhad (DNB) under the Ministry of Finance. The aim of this initiative is to boost 5G adaptation in the country reducing infrastructure costs and differences in the service provided between MNOs. Thus, DNB acts as a de facto MNO focused in 5G that does not provide service to individual customers.
Co-location opportunities in the whole territory
- Existing sites with room for 5G cells may be of interest for DNB, depending on its deployment strategy at the moment.
- The situation is very balanced for all MNOs, with all of them having very similar room for offering and receiving co-location opportunities. However, regional differences could prove relevant.
Potential BTS opportunities in urban areas
- The deployment of 5G infrastructure by Digital Nasional Berhad (DNB) may require new sites in areas where pre-existing sites are already at capacity.
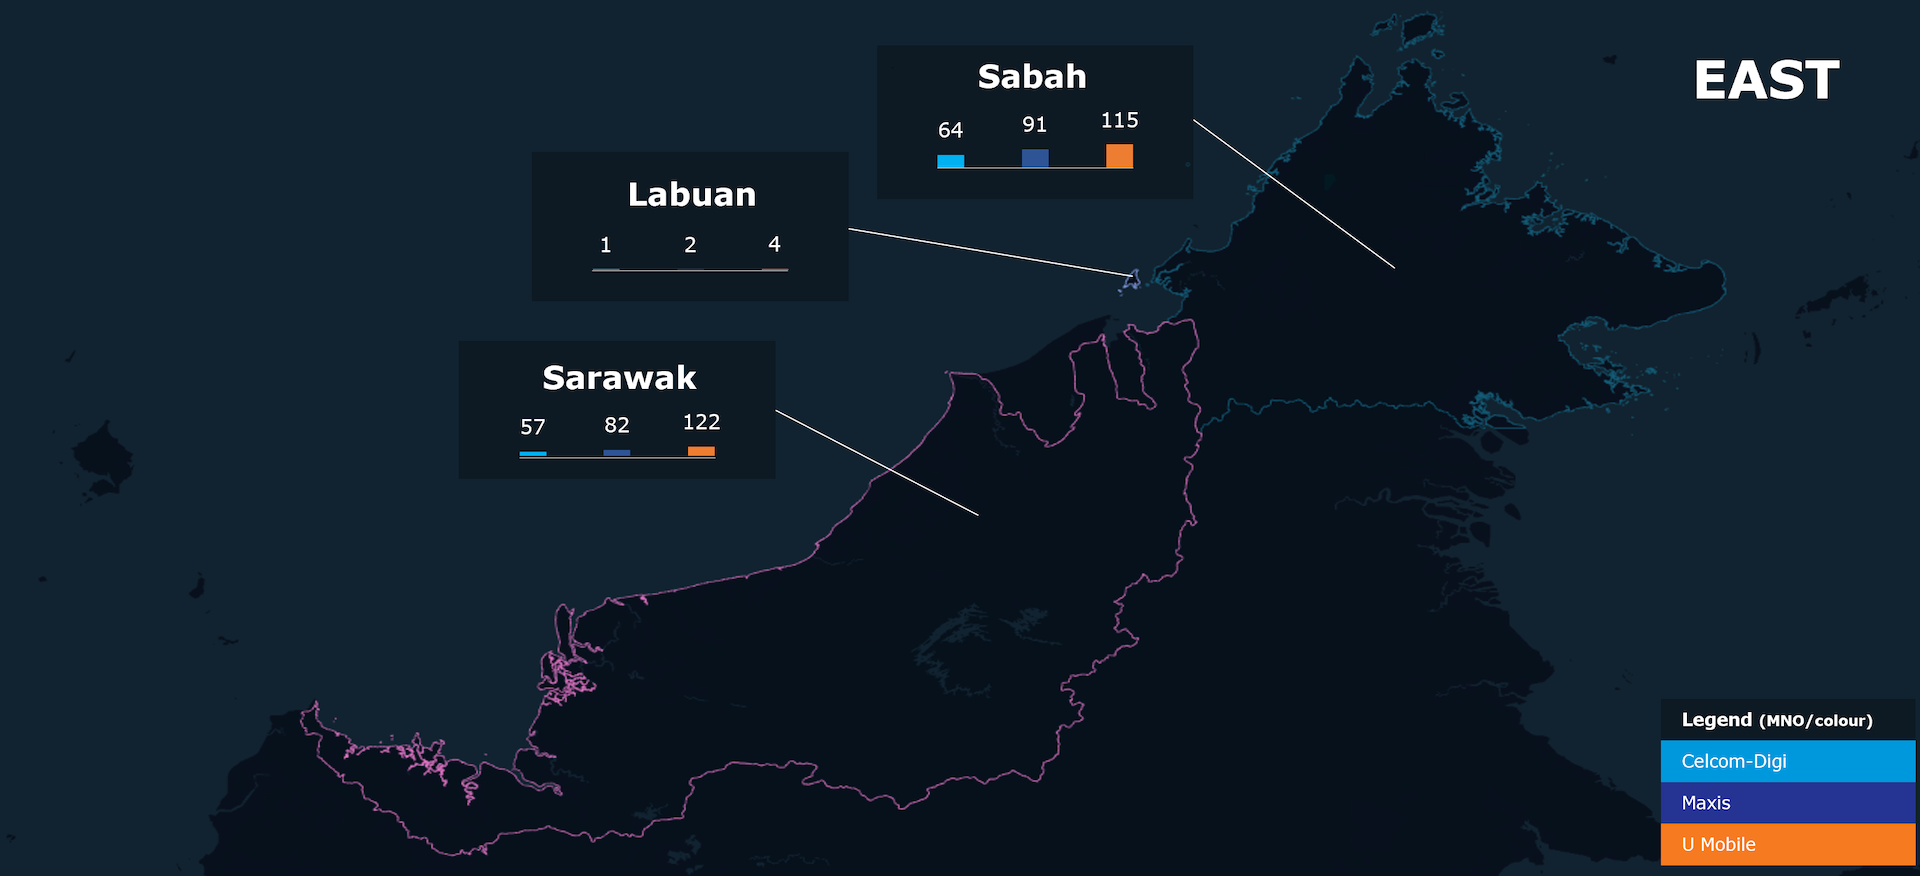
- The regions with more urban BTS opportunities are Sabah (21% of all urban BTS opportunities), Sarawak (21%) and Johor (12%).
Methodology
Under this section an in-depth description of each analyzed KPI can be found, including the methodology and rationale behind them. At a more general level, the following paragraph describes the data collection methodology.
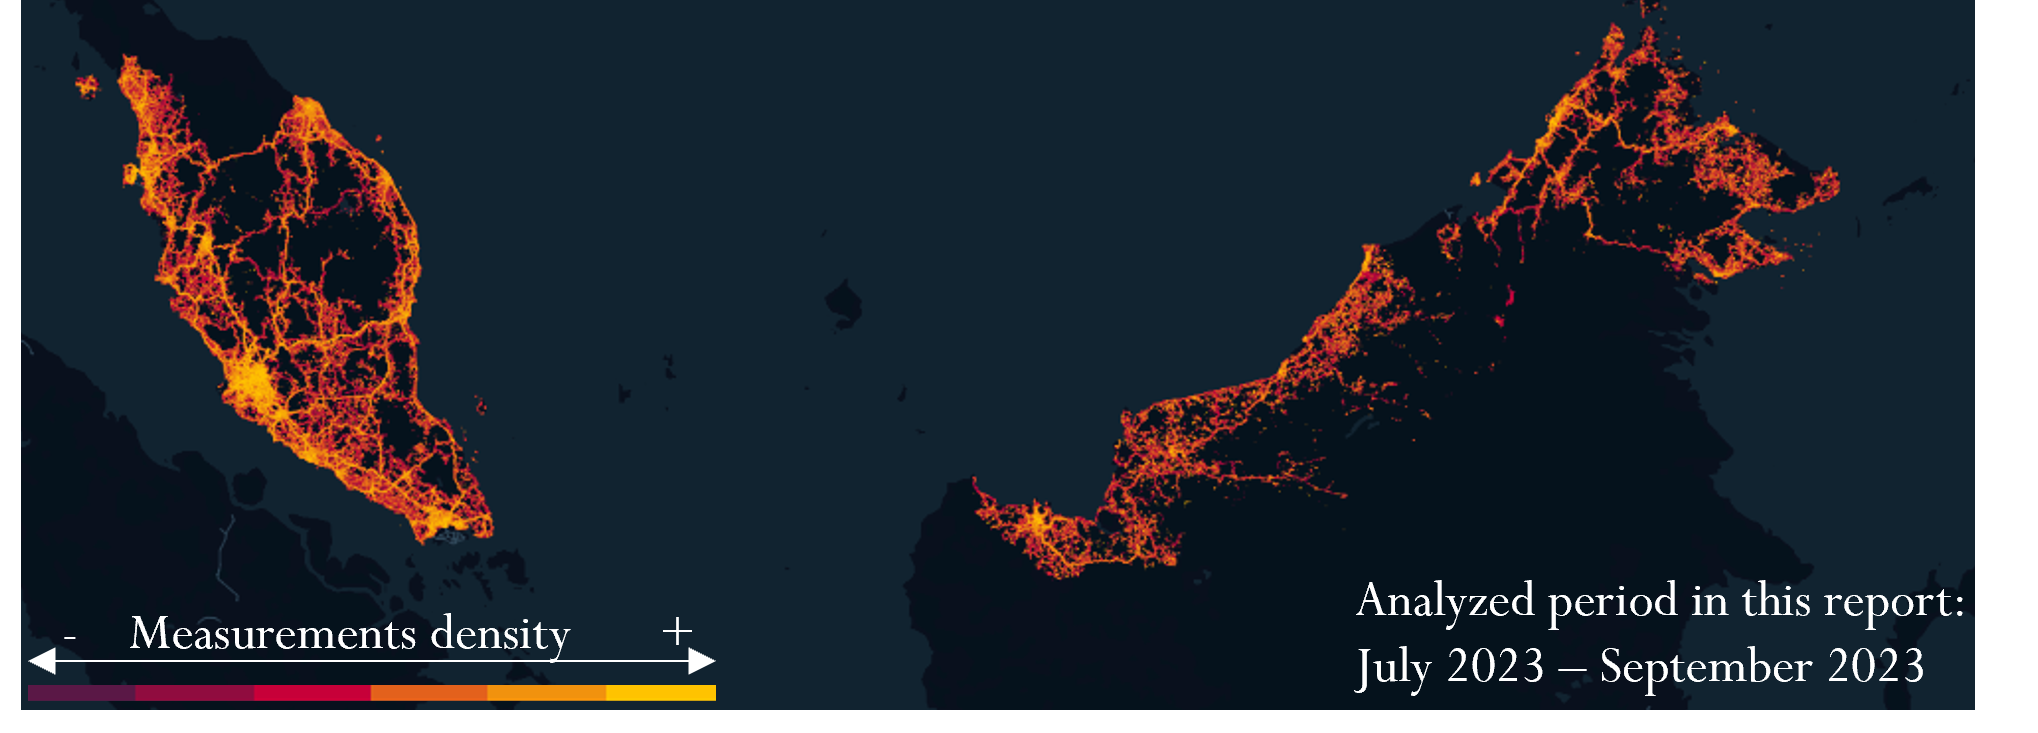
At a more general level, Weplan Analytics collects crowdsourced data from more than 200 million devices in 31 countries. For this analysis, 306 million measurements collected between july and september 2023 were used.
The following map shows the density of measurements taken throughout Malaysia by Weplan Analytics.
The most relevant insights can be found in the Summary section above. A detailed account of each one comprises the rest of the report below.
As the three aforementioned MNOs serve their networks to other parties (such as VMNOs, due to roaming agreements or as part of emergency coverage) they have been filtered by the network provider reported in the SIM card.
More details about the methodology can be found here.
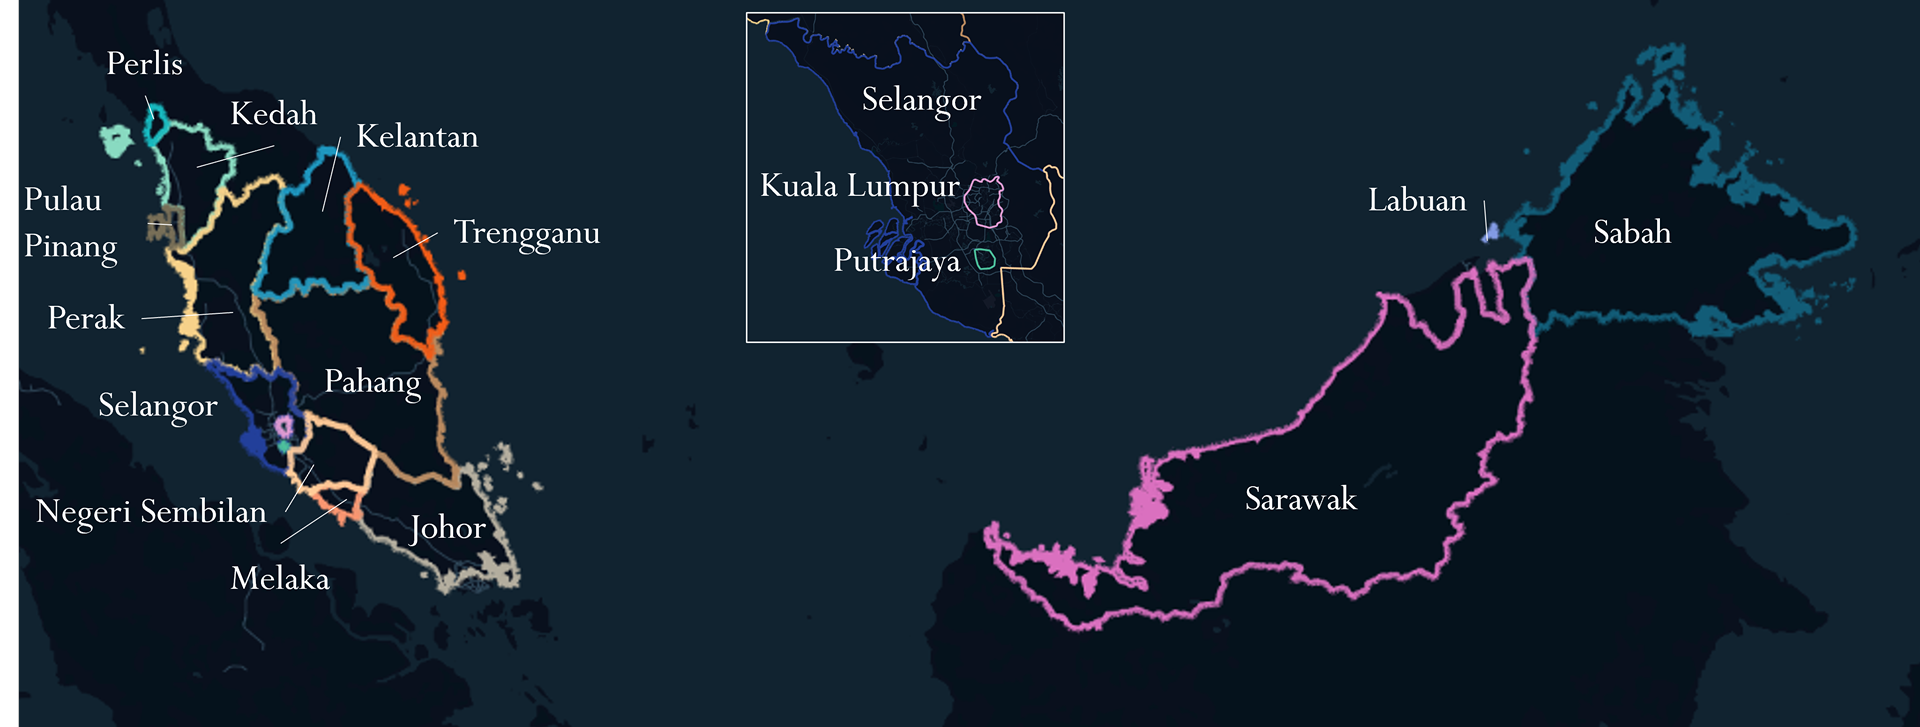
Division of Malaysia for the analysis
The federal character of Malaysia may impact heavily on regional differences. To ensure that these differences are properly captured, the analyses (except for co-location analysis) will be conducted for all the 13 states (Negeri) and 3 federal territories (Wilayah Persekutuan) of Malaysia.
Block 1A: Differences in coverage by MNO in the whole territory
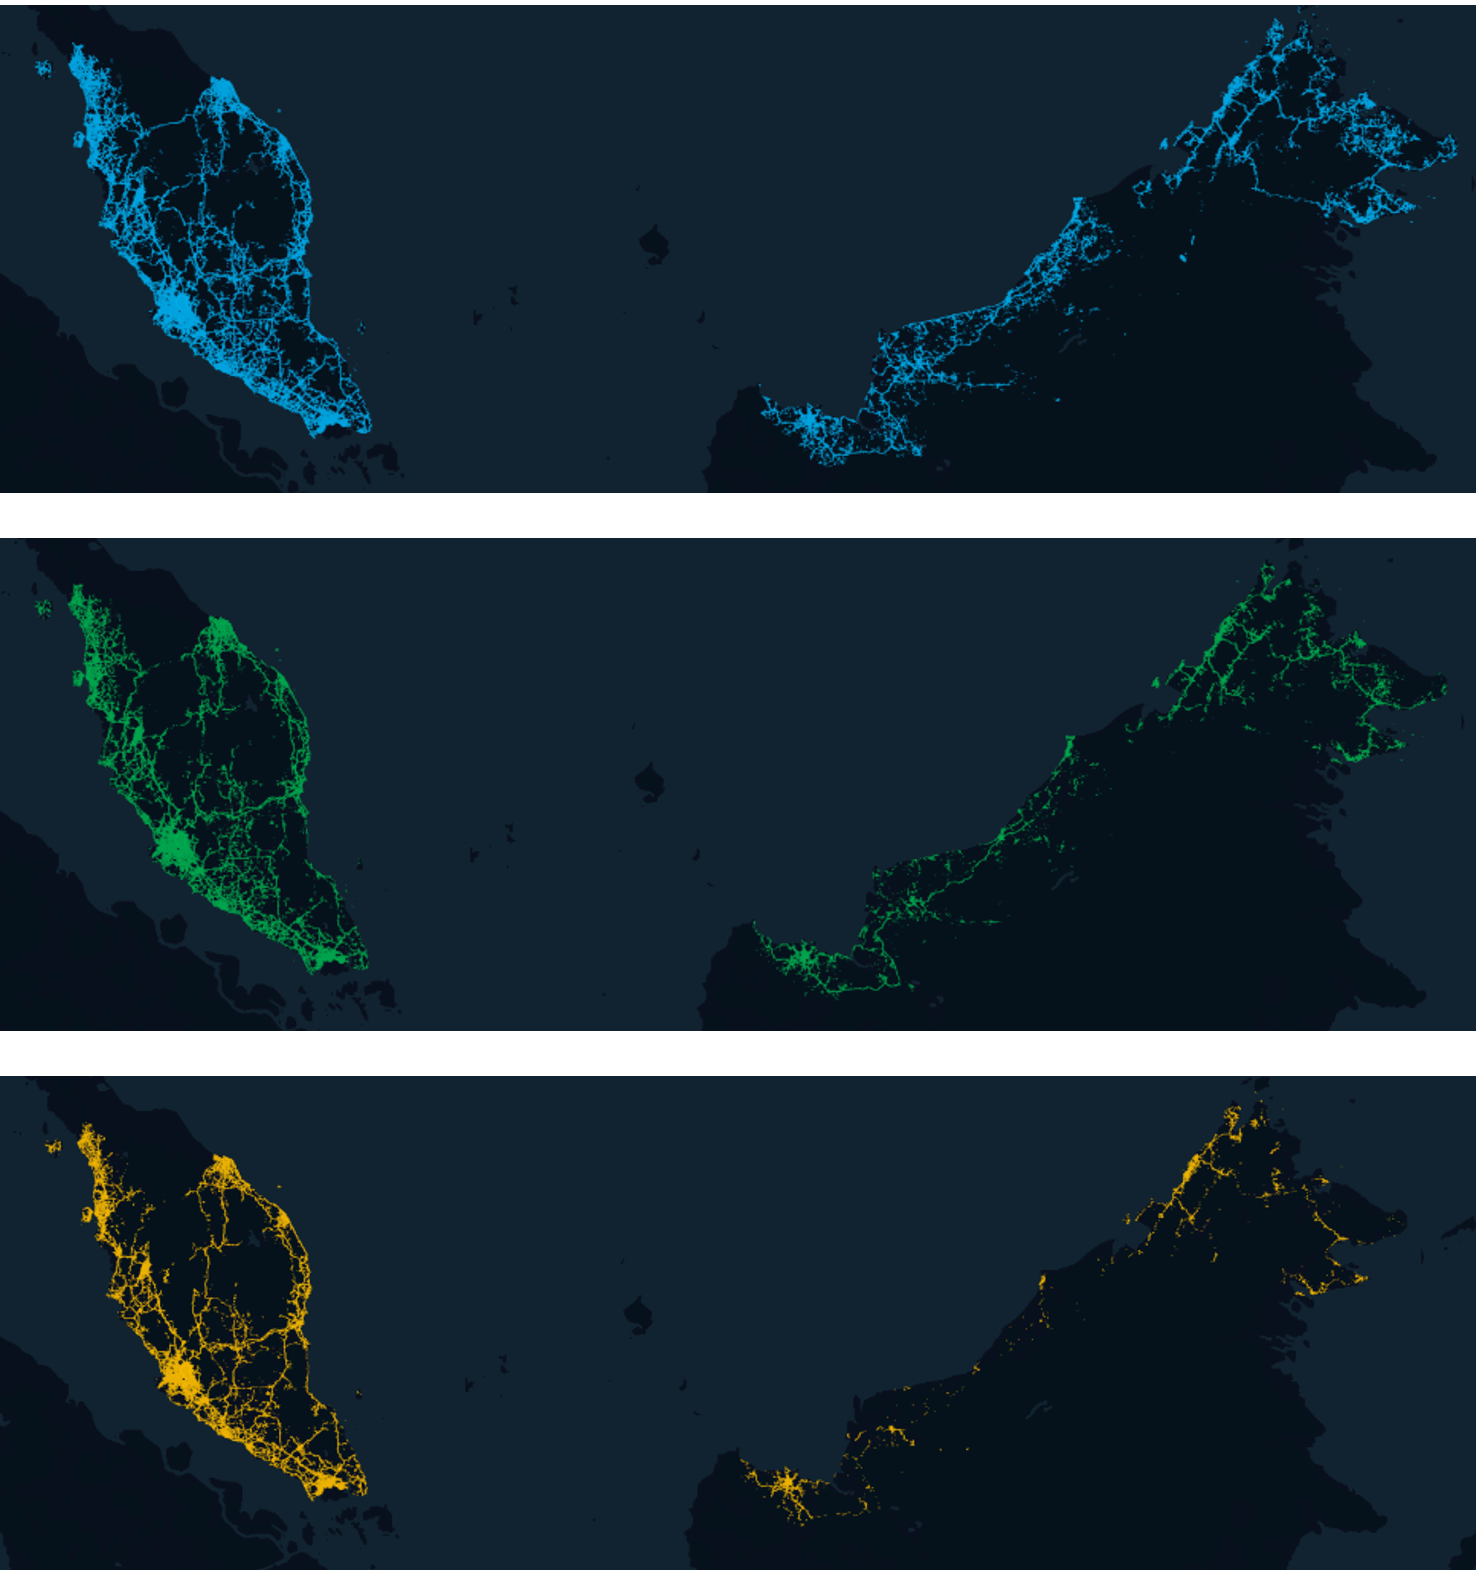
CelcomDigi has a more extense coverage area than its competitors, specially in rural regions of Sabah and Sarawak in the isle of Borneo, alongside with rural areas countrywide. This difference in coverage means that U Mobile has the most potential for BTS opportunities.
The images show the coverage area for each MNO.


Block 1B: Degraded coverage areas in the whole territory
An estimate of the percentage of the coverage area that shows signs of degradation can be calculated. The results by zone are in the following subsection. Some global highlights are the following:
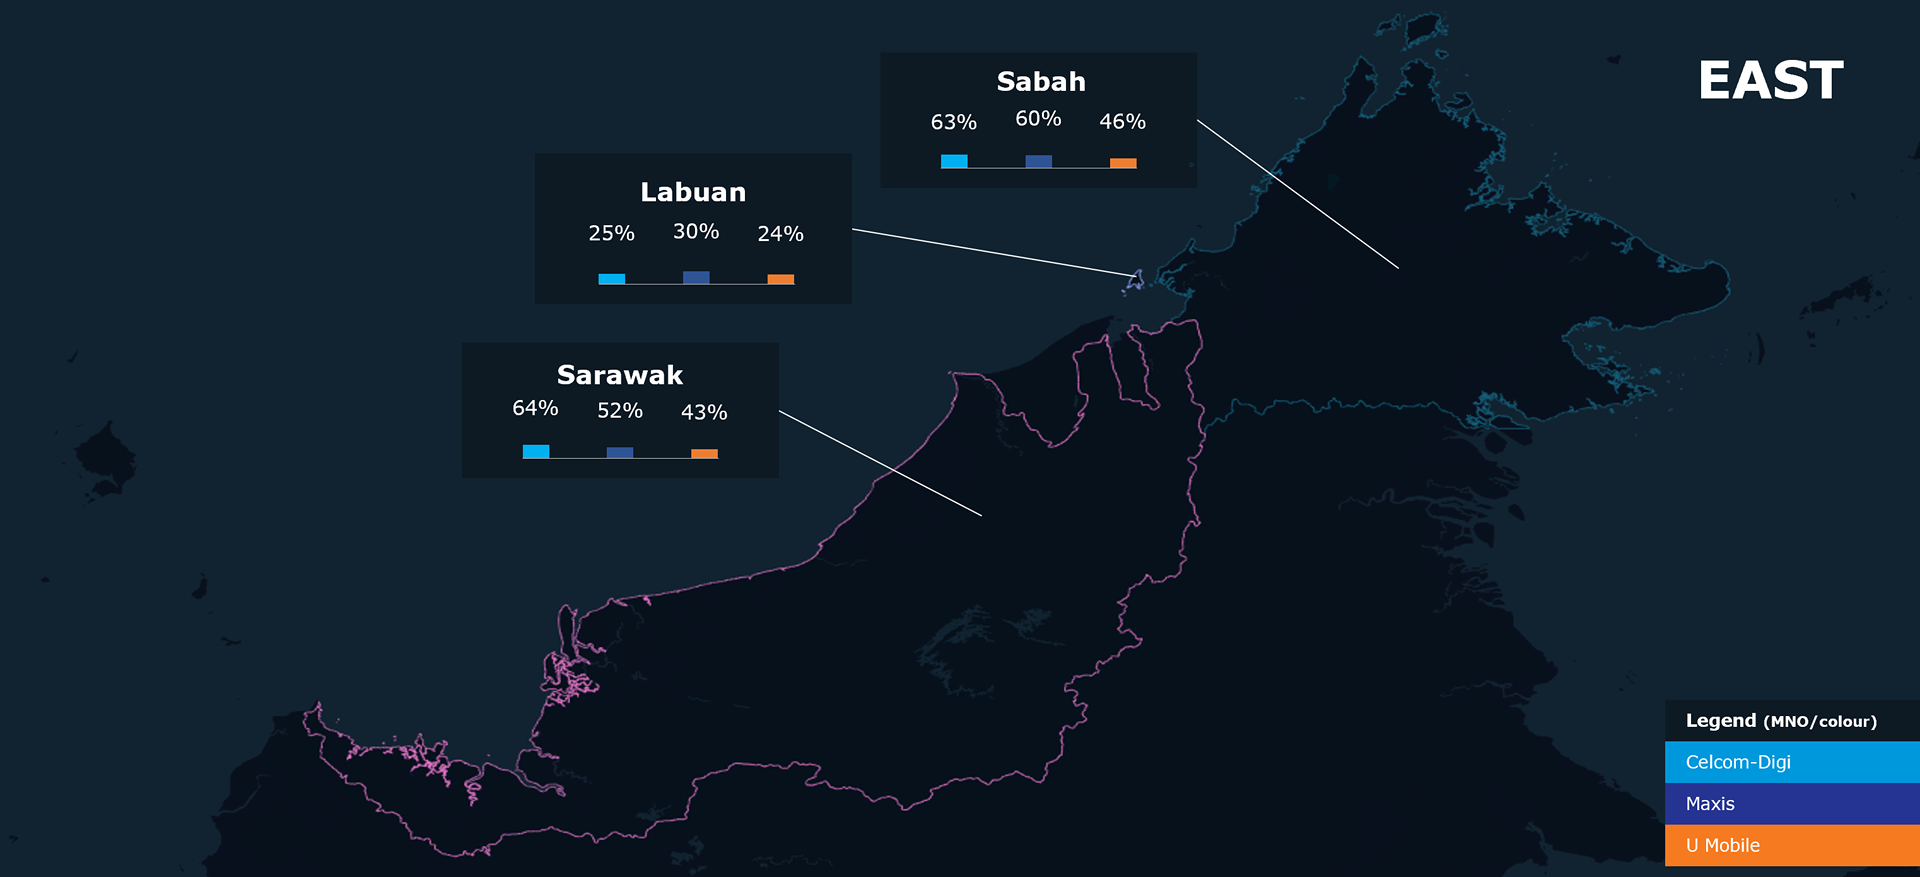
- There are three great groups of regions regarding coverage: Kuala Lumpur and Putrajaya (the economic and administrative capitals, with great coverage situation, with less than 3% of its coverage area showing degradation); Sarawak and Sabah (in Borneo, with overall nearly 60% of its coverage area showing signs of degradation); and the rest of regions, with an intermediate situation (ranging from 13% to 37% of the area showing degradation).
- Globally, U Mobile is the carrier with less percentage of its coverage area showing signs of degradation (around 28%). Maxis comes second, with 38% of its area showing degradation, and CelcomDigi reaches 44% of its area showing signs of degradation.
- It is worth noting that CelcomDigi provides a more extensive coverage in very rural areas in Borneo. If Sabah and Sarawak are omitted, the percentage of degraded areas is more similar: U Mobile still leads with a 25% of its area showing signs of degradation; Maxis follows with a 30% of its area showing degradation and CelcomDigi now has a 32% of its area showing degradation.
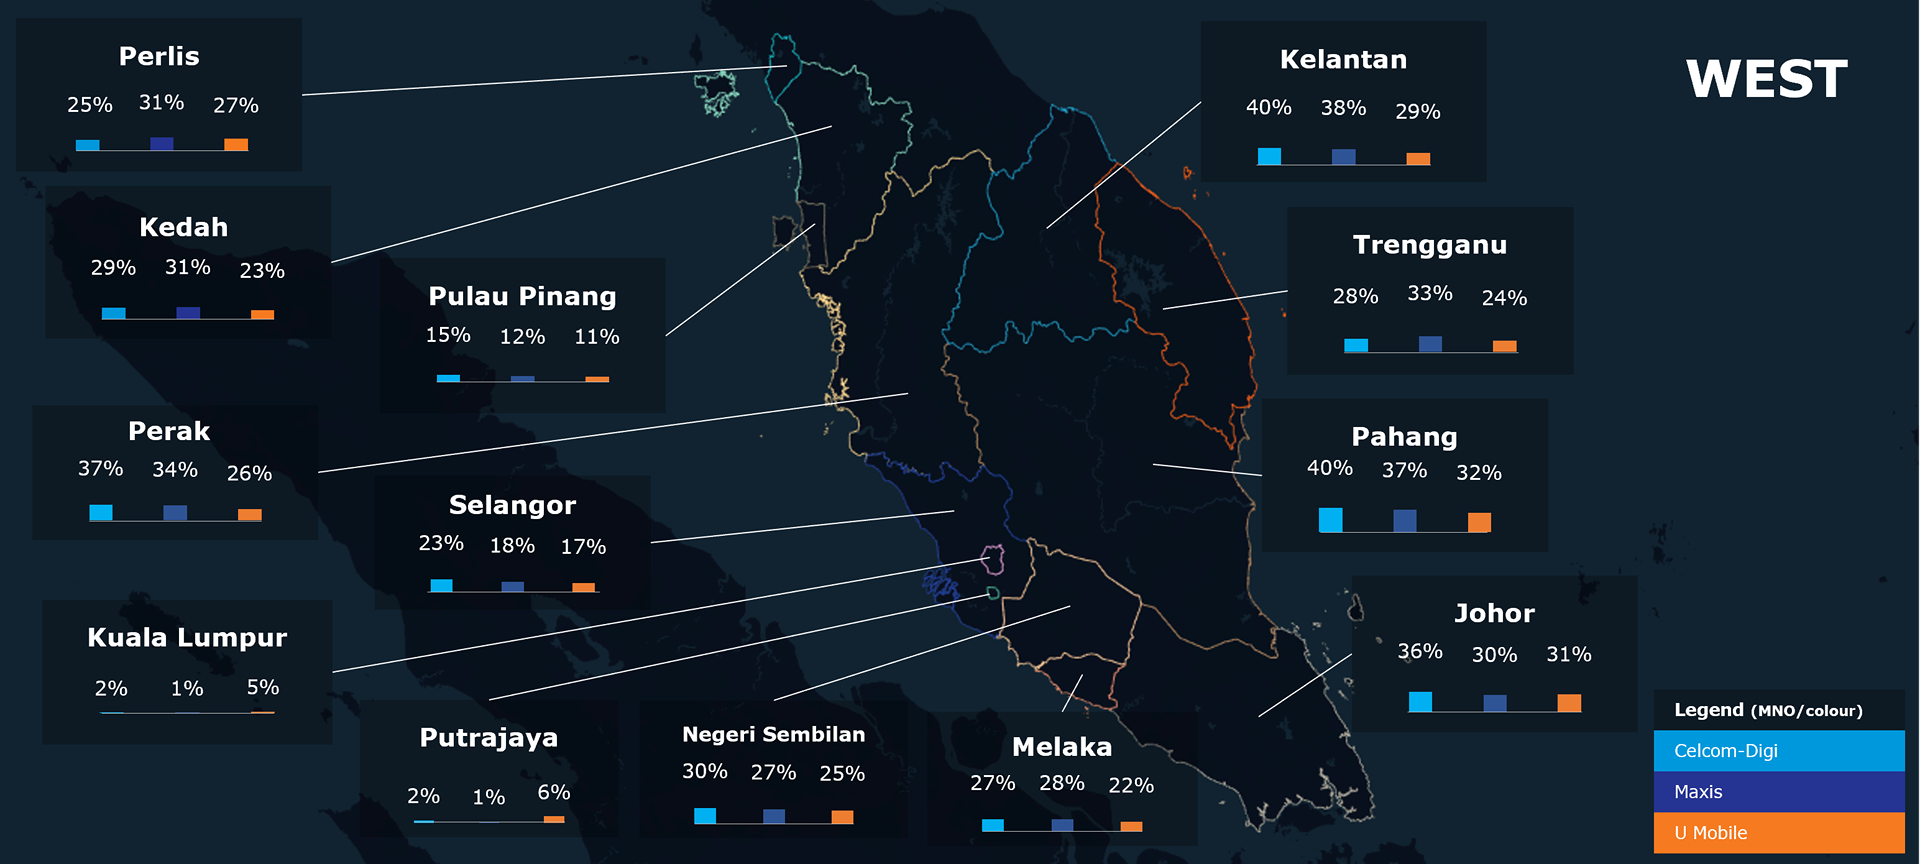
Degraded coverage areas by region
Percentage of coverage area showing degradation signs (in 4G) by MNO and region. 5G is omitted, as degraded 5G coverage is equal as it is deployed by DNB.
Block 1C: Potential co-location opportunities in the whole territory
An estimate of the percentage of the current coverage area where there could be co-location agreements can be estimated. Some global highlights are the following:
- Existing sites with room for 5G cells may be of interest for DNB, depending on its deployment strategy at the moment.
- The situation is very balanced for all MNOs, with all of them having very similar room for offering and receiving co-location opportunities. However, the situation on certain regions may be slightly different.
The following chart shows in the horizontal axis the carrier providing a co-location opportunity, and in the vertical axis the MNO that would benefit from it:
Block 2: Potential BTS opportunities in urban areas
A downward estimate of the number of sites needed to support the already existing deployment can be calculated.
This takes into account both areas with degradation and areas where a MNO has no coverage. The results by zone are in the following subsection.
Only urban areas have been considered, to ensure that all MNOs are compared under similar situations.
Some global highlights are the following:
- The deployment of 5G infrastructure by DNB may require new sites in areas where pre-existing sites are already at capacity.
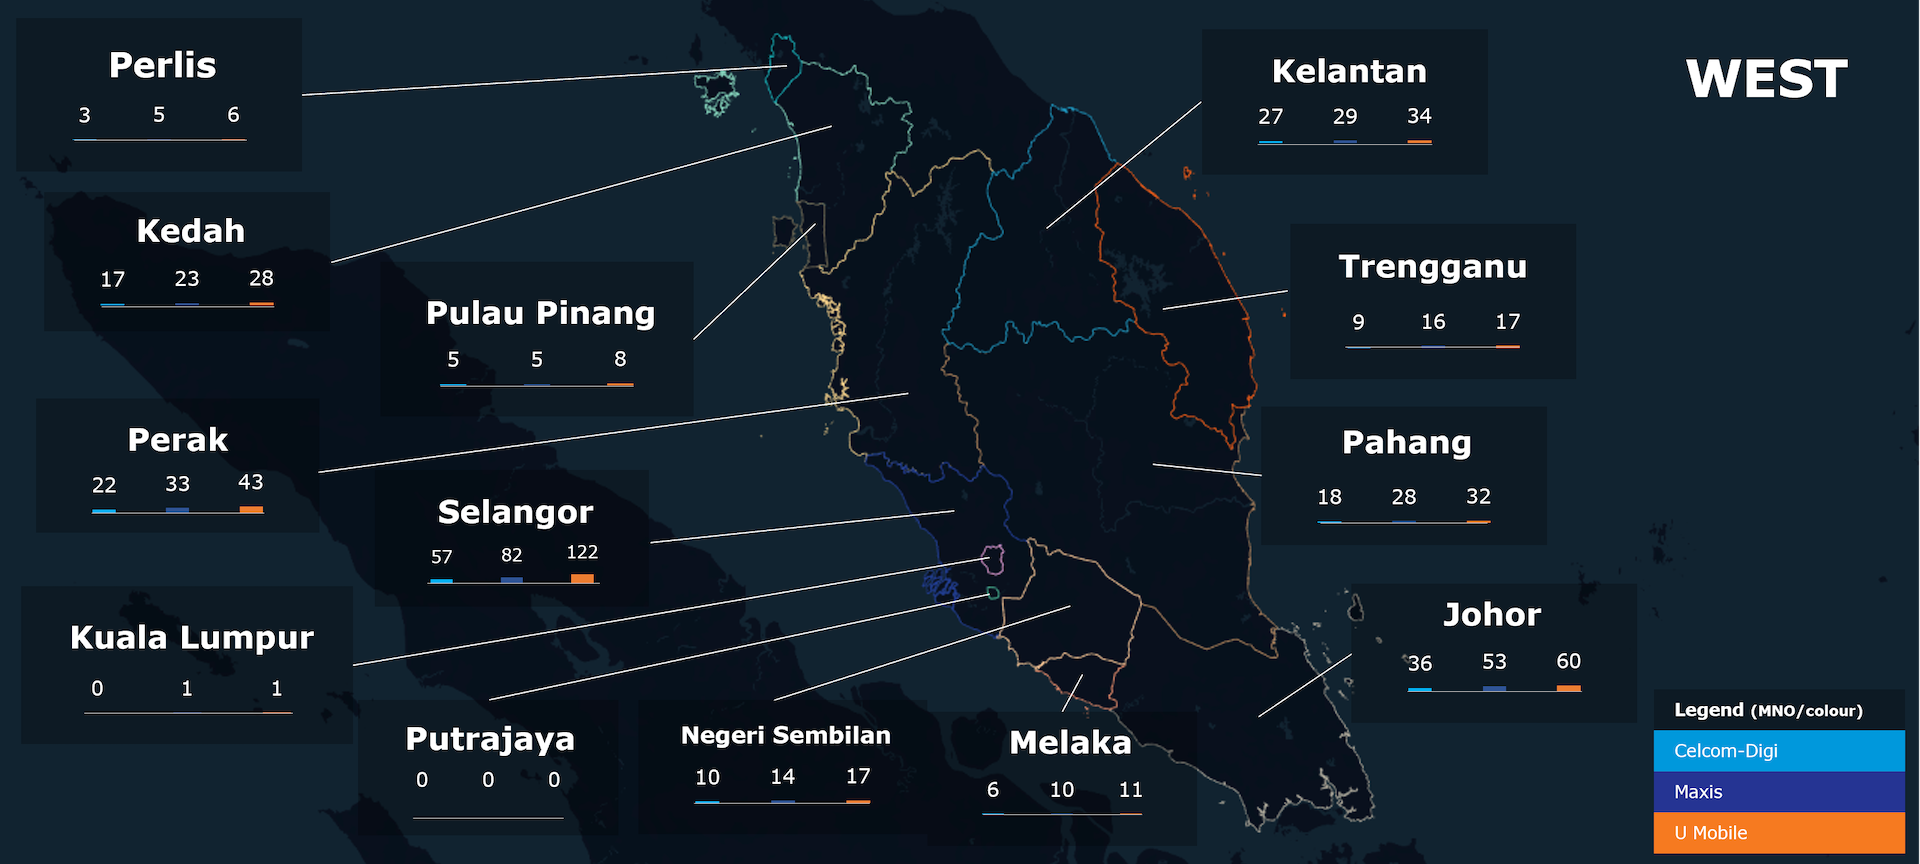
- There are great contrasts among areas of Malaysia: whereas the dense areas of Kuala Lumpur, Putrajaya and Labuan show close to no urban BTS opportunities, Sabah and Sarawak reach at least 40 BTS opportunities in urban areas per MNO and region.
- Other regions exhibit intermediate values, between 15 and 50 towers for most regions and MNOs.
- As the MNO with the smallest coverage area, U Mobile has the largest number of BTS opportunities in urban areas.
Potential BTS opportunities in urban areas by region
Number of BTS opportunities based on 4G needs by MNO and region. 5G is ommited, as 5G coverage is equal for all MNOs, as it is deployed by DNB.

To read the report please leave us your details:
An email will be sent to your address with a link to unlock it:
The information on this report is provided as of public interest by Weplan Analytics. The information on this report is provided by Weplan Analytics solely for the user's information and it is provided without warranty, guarantee or responsibility of any kind, either expressed or implied. Weplan Analytics and its employees will not be liable for any loss or damages of any nature, either direct or indirect, arising from use of the information provided in this report. Weplan Analytics is the owner of copyright in all material or information found on this report unless otherwise stated. All contents that are published in this report are safeguarded by copyright. This copyright includes the exclusive right to reproduce and distribute the contents, including reprints, translations, photographic reproductions, electronic forms (online or offline) or other reproductions of other similar kinds. Only non-commercial use may be beyond the limitations with prior written consent. Journalists are encouraged to quote information included in Weplan Analytics reports and insights as long as clear source attribution is provided. For more information, contact [email protected]