
Growth opportunities for TowerCos Report Methodology
Data collection
The data collected by Weplan is crowdsourced through an SDK introduced in smartphone apps. Currently, at Weplan Analytics we measure anonymously information on the quality of the network and the coverage of all mobile operators, through hundreds of apps and millions of devices worldwide. We reach partnership agreements with these apps to implement our SDK in their code, we pay them for active users and we, therefore, get anonymous network data provided by Smartphone users.
Our Key Performance Indicators
Differences in coverage by MNO
Not all MNOs may have the same coverage 4G and 5G along the country. Global and regional differences may help TowerCos to properly approach MNOs. Rather than a KPI, this is a way of working and analyzing data, tailored to the situation of each country. While some countries may have a very homogeneous network situation, regardless of the region and MNO analyzed, others have vastly different situations on their regions, either political or geographical.
At the moment of creating the report, our team of analysts carefully assesses the situation of the country to decide what type of geographical aggregation provides the best insights into the opportunities availables for TowerCos. Also, a comparison between MNOs is performed: the MNO with the highest percentage of covered area is used as a baseline, and the covered area other MNOs is expressed as a percentage of the leading MNO coverage area. As an example, suppose a country with two MNOs. The leading MNO covers 100 km^2 in the country, and the second MNO covers only 80 km^2 out of those 100 km^2. Thus, the leading MNO has 100% of coverage compared to itself, and the second MNO has 80% of coverage compared to the leading MNO.
Degraded coverage areas
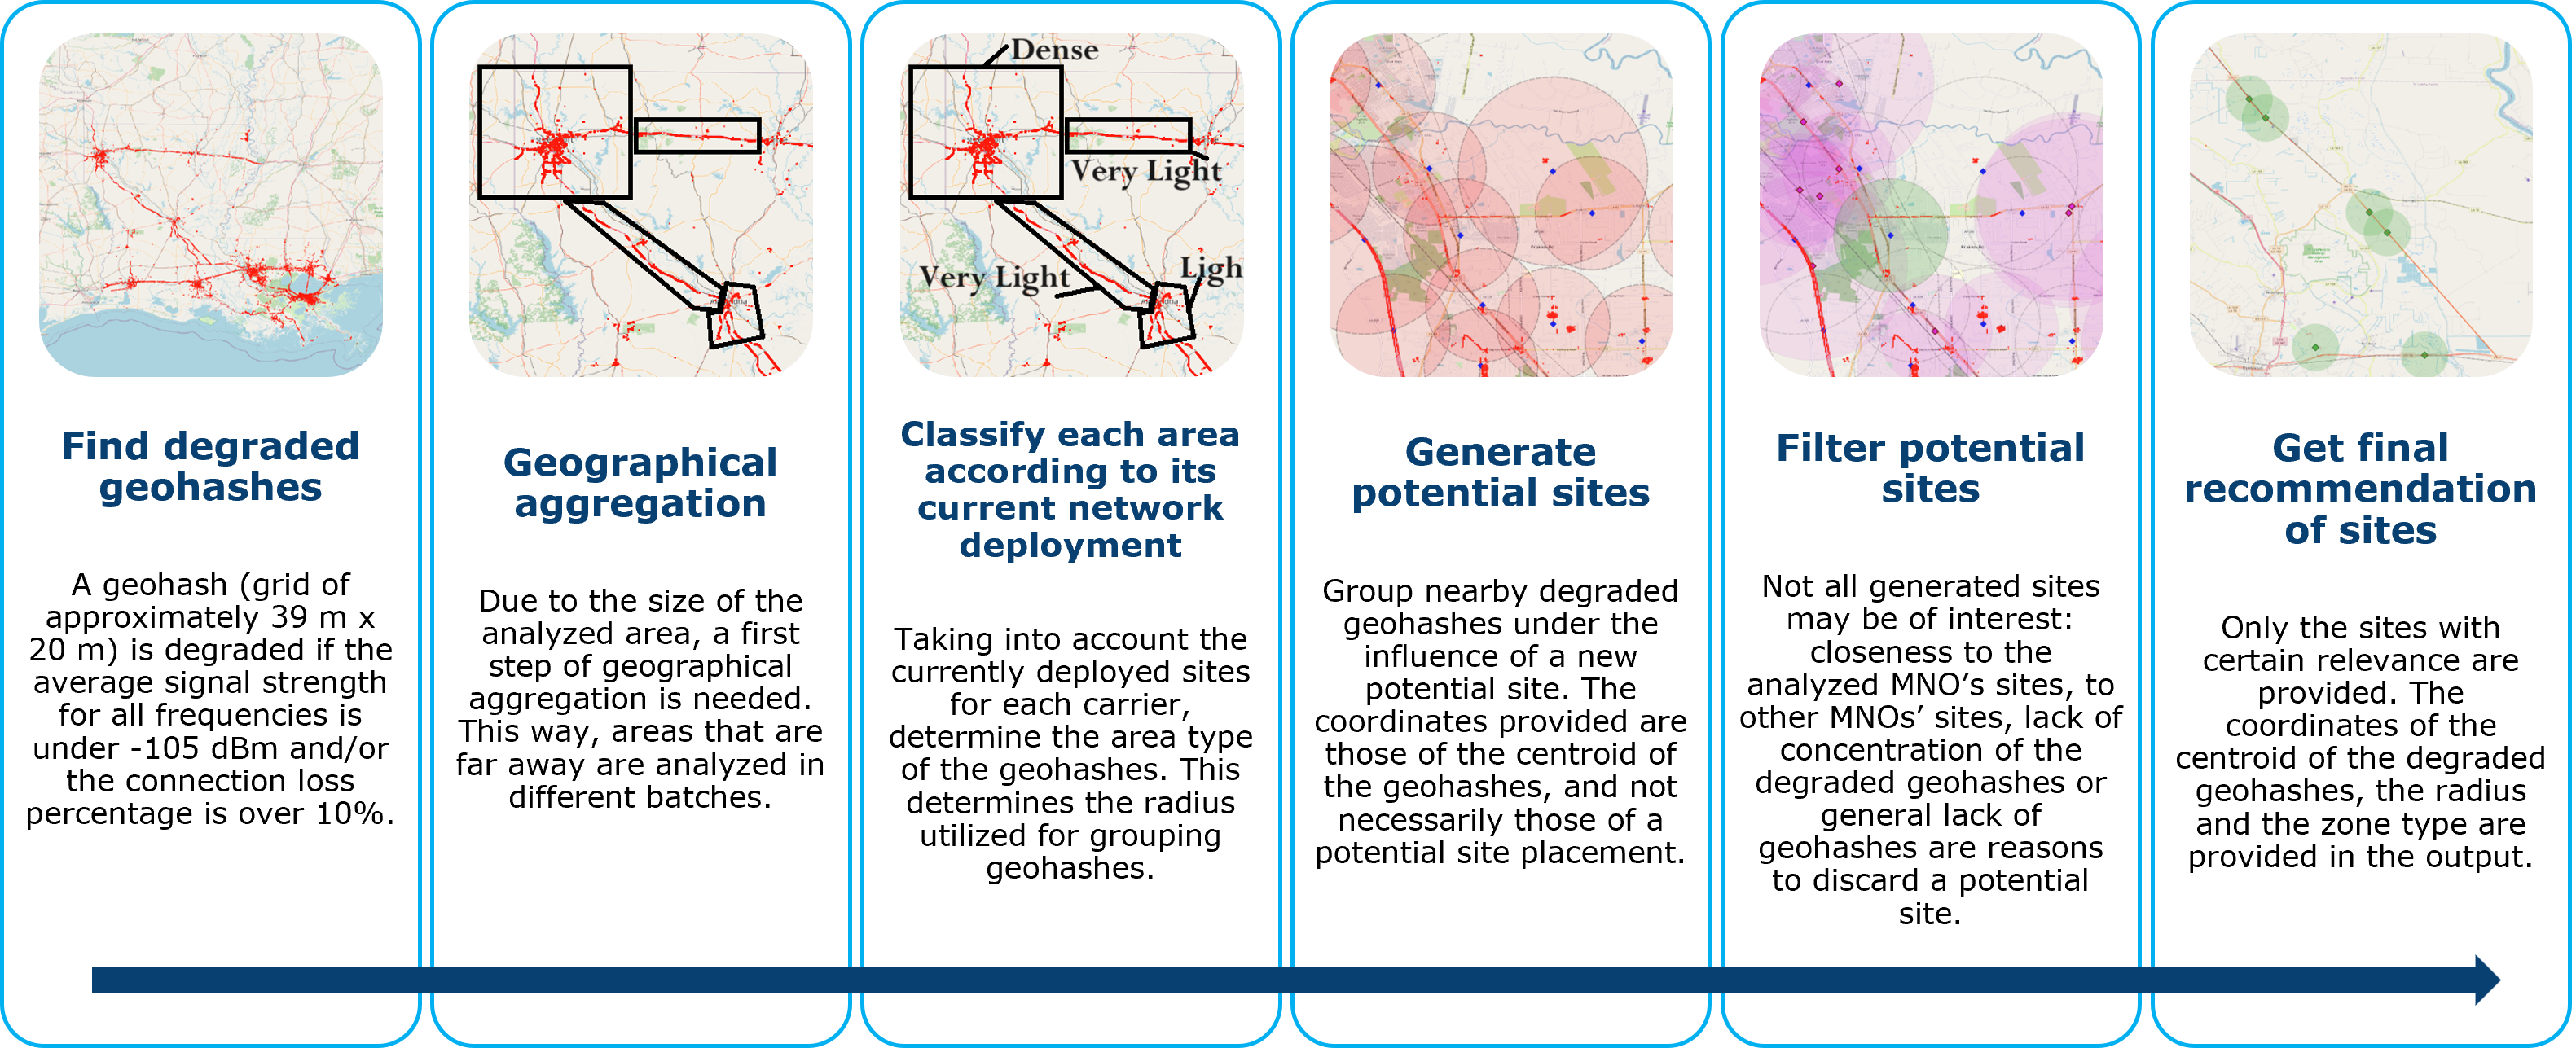
Areas of the country where the network (in 4G and possibly 5G) shows degradation. Those are the areas where new solutions or network reconfigurations are more interesting. To detect areas with degraded coverage, the geotagged data is grouped in grids of approximately 1.2 km x 609.4 m (geohash level 6). Then, the coverage for each MNO is analyzed in said grid. An element of the grid is considered to have degraded coverage if at least one of the two following condition occurs:
- The average signal strength for all frequency bands is under -105 dBm.
- The percentage of measurements showing connection loss or limited connection (i.e, connection to a different MNO with only emergency calls) is over 10%.
To ensure the statistical soundness of the analysis, a minimum sample size is required for a geohash to be analyzed.
Potential co-location opportunities
Co-location agreements reduce the building, installation and maintenance costs for MNOs, while improving profitability for TowerCos and optimizing space usage and resources for everyone. The geotagged measurements are grouped in partitions of 150 m x 150 m (geohash level 7) and the coverage of each carrier in said partitions is compared. If a carrier (carrier A) has poor connectivity and a competitor (carrier B) has a signal strength of at least +15 dBm than the analyzed carrier, then the TowerCo managing carrier B may be in position of offering a lease-up agreement to carrier A in the partition. Then, the percentage of partitions where both carriers are present and there is a co-location opportunity is provided. For example, if there are 100 geohashes where both carrier A and carrier B are present, in 5 of them carrier A has better situation than carrier B and in 6 of them carrier B has better situation than carrier A, then there would be a 5% of co-location opportunities for carrier B using carrier A sites and a 6% of co-location opportunities for carrier A using carrier B sites.
Potential BTS opportunities in urban areas
Urban areas are some of the most interesting zones for performing new deployments for MNOs. Thus, an estimate of the current BTS needs in those type of areas is provided. Using Machine Learning techniques, an accurate estimate of the BTS needs of a region can be calculated. The process followed is described in the following image:
Proud member of: