Introduction
The American mobile market comprises several operators, of which three have a dominant position: AT&T, T-Mobile and Verizon. Regarding mobile telecommunications, MNOs are the main player of interest for TowerCos. The objective of this report is to provide a summary of the current opportunities for TowerCos in the country as a preliminary estimate.
This report provides this summary based on the following KPIs:
- Differences in coverage by MNO: not all MNOs may have the same coverage 4G and 5G along the country. Global and regional differences may help TowerCos to properly approach MNOs.
- Degraded coverage areas: areas of the country where the network (in 4G and possibly 5G) shows degradation.
- Potential co-location opportunities: co-location agreements (site sharing agreements) reduce the building, installation and maintenance costs for MNOs, while improving profitability for TowerCos and optimizing space usage and resources for everyone.
- Potential BTS opportunities in urban areas: urban areas are some of the most interesting zones for performing BTS (new deployments) for MNOs.
This report is divided in two great blocks:
- Block 1, with an analysis at a global level.
- Block 2, focused on BTS opportunities in urban areas, where deployments are more adjusted and optimized.
Summary
The United States of America, the largest economy and the third most populated country in the world, is home to around 336 million people and a world-class economy with a consolidated telecommunications market ripe with opportunities.
Three mayor players dominate the mobile market with their own networks: AT&T, T-Mobile and Verizon. These three MNOs together have 97% of the market share in the USA. Regional MNOs are still very relevant in the most sparsely populated areas of the country, but their size and focus make it difficult to stablish a fair comparison.
Due to differences in coverage among the main carriers, only their common area of activity (the Contiguous United States) will be analyzed. This part of the country houses 99% of the population and most of the economic activity. From this point, all mentions of the USA will make reference to the contiguous USA.
AT&T is the leading MNO in the USA with a 46% of market share. Verizon follows with a 28% of market share. Finally, T-Mobile, the US branch of the German Telekom, is the third contending operator with a 23% of market share. All these figures include MVNOs subscribers. This scenario makes the American market a very dynamic and attractive one.
Co-location opportunities in the whole territory
- Verizon is the MNO with the highest co-location potential, with between 9% and 11% of its coverage area being of interest for the other MNOs.
- Conversely, T-Mobile offers the lowest co-location potential, with at least a 6% of its coverage area being of interest for the other MNOs.
- It is worth noting that in the USA towers are mostly owned by TowerCos, so co-location agreements are more usual. This figures make reference to new co-location opportunities, without taking into account already existing agreements.
Potential BTS opportunities in urban areas
- T-Mobile has the highest number of BTS opportunities, whereas Verizon (the first MNO in the country by coverage area) has the least number BTS opportunities.
- All MNOs, however, exhibit great number of BTS opportunities in a similar range.
Methodology
Under this section an in-depth description of each analyzed KPI can be found, including the methodology and rationale behind them. At a more general level, the following paragraph describes the data collection methodology.
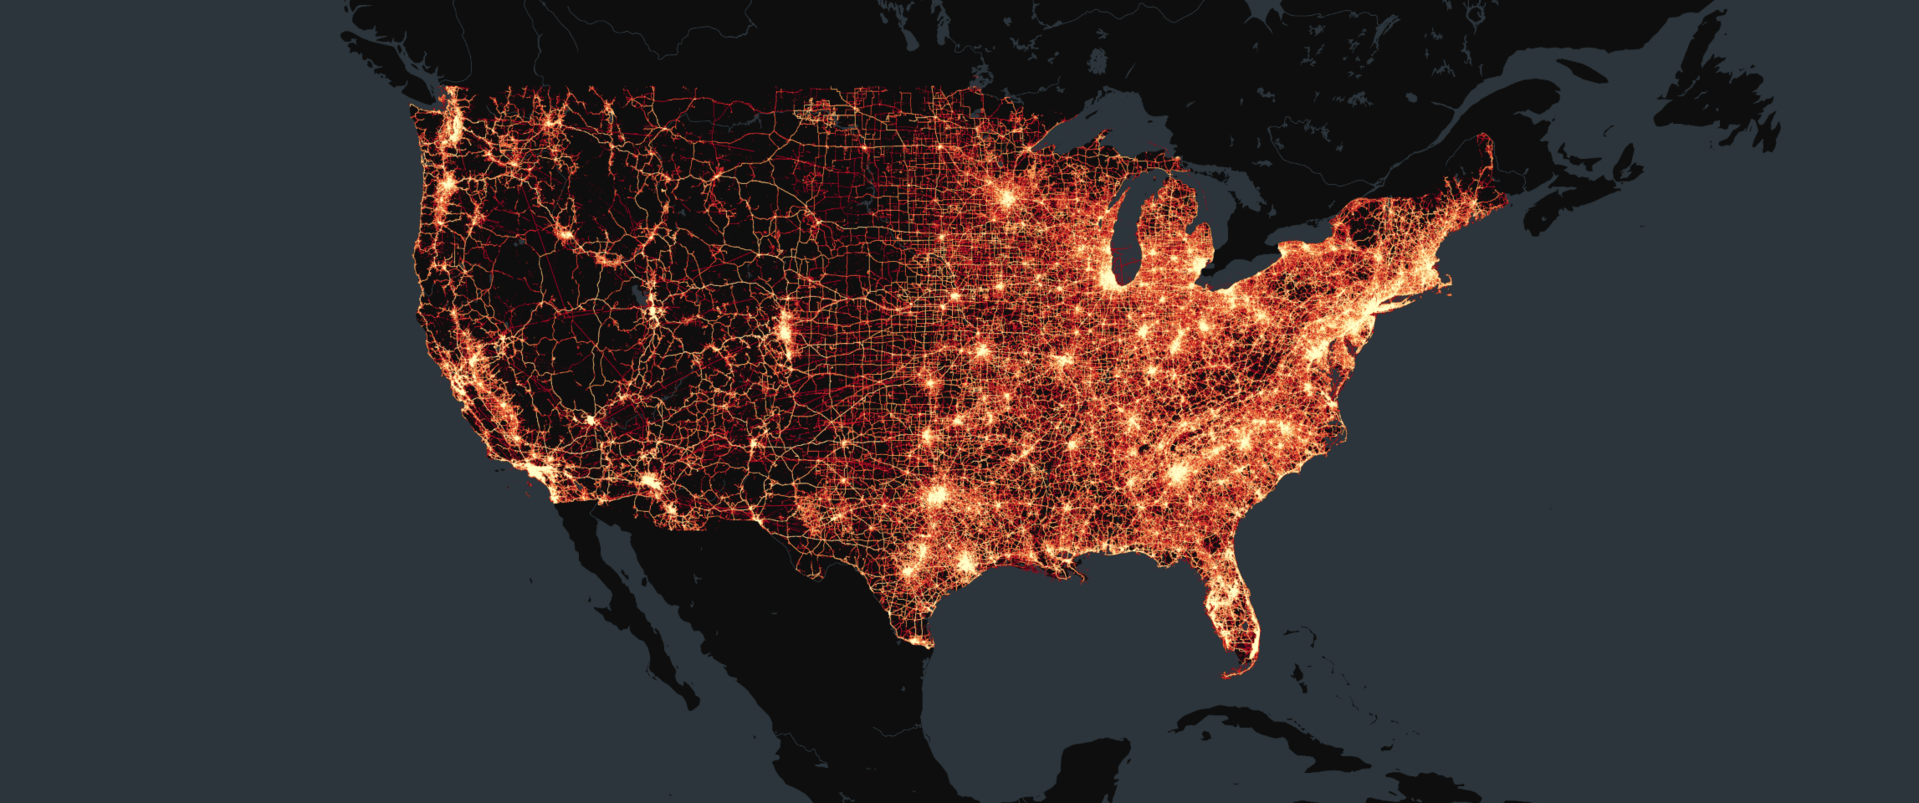
At a more general level, Weplan Analytics collects crowdsourced data from more than 200 million devices in 31 countries. For this analysis, 3,496 million measurements collected between January and March 2024 were used.
The following map shows the density of measurements taken throughout the USA by Weplan Analytics.
The most relevant insights can be found in the Summary section above. A detailed account of each one comprises the rest of the report below.
As the three aforementioned MNOs serve their networks to other parties (such as VMNOs, due to roaming agreements or as part of emergency coverage) they have been filtered by the network provider reported in the SIM card.
More details about the methodology can be found here.

Block 1A: Differences in coverage by MNO in the whole territory
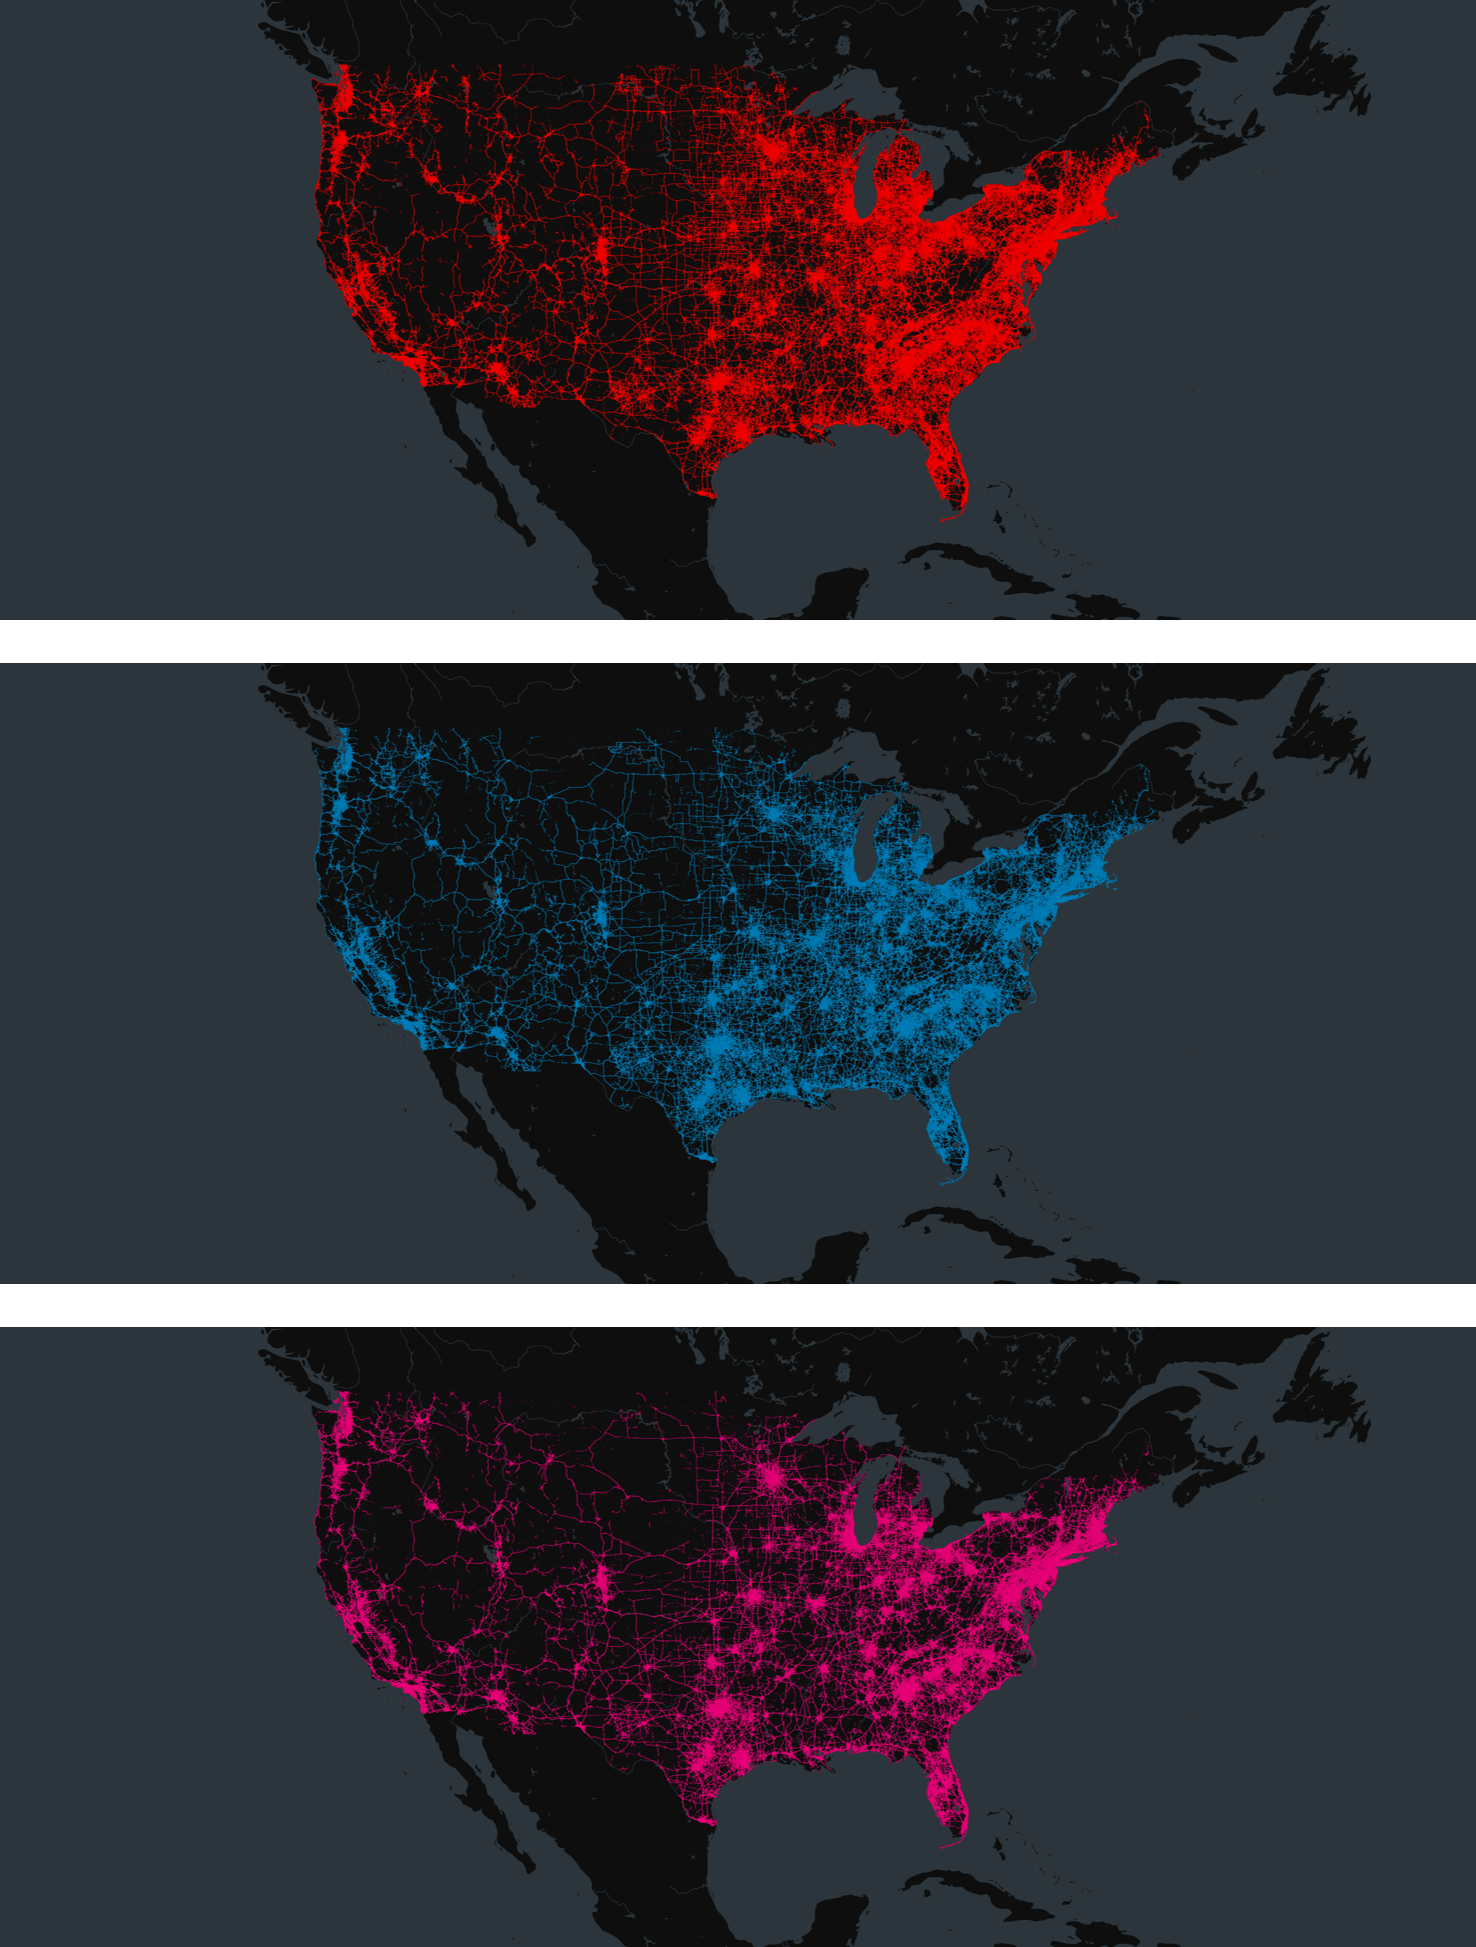
Verizon has a more extense coverage area than its competitors. This difference in coverage means that T-Mobile has the most potential for BTS opportunities.
The images show the coverage area for each MNO.


Block 1B: Degraded coverage areas in the whole territory
An approximated calculation of the percentage of the coverage area that shows signs of degradation can be estimated. Some global highlights are the following:
- Verizon is the carrier with less percentage of its coverage area showing signs of degradation (around 14%).
- AT&T is a close second showing signs of degradation in around 16% of its coverage area.
- Approximately a 23% of the coverage area of T-Mobile shows signs of degradation.


Block 1C: Potential co-location opportunities in the whole territory
An estimate of the percentage of the current coverage area where there could be co-location agreements can be calculated. Some global highlights are the following:
- Verizon is the MNO with the highest co-location potential, with between 9% and 11% of its coverage area being of interest for the other MNOs.
- Conversely, T-Mobile offers the lowest co-location potential, with at least a 6% of its coverage area being of interest for the other MNOs.
- It is worth noting that in the USA towers are mostly owned by TowerCos, so co-location agreements are more usual. This figures make reference to new co-location opportunities, without taking into account already existing agreements.
The following chart shows in the horizontal axis the carrier providing a co-location opportunity, and in the vertical axis the MNO that would benefit from it. The color indicates the offering MNO, that is, the representative color throught the report for the MNO in the horizontal axis:
Block 2: Potential BTS opportunities in urban areas
A downward forecast of the number of sites needed to support the already existing deployment can be determined.
This takes into account both areas with degradation and areas where a MNO has no coverage. For this calculation densification needs have not been taken into account.
Only urban areas have been considered, to ensure that all MNOs are compared under similar situations.
Some global highlights are the following:
- T-Mobile has the highest number of BTS opportunities, whereas Verizon (the first MNO in the country by coverage area) has the least number BTS opportunities.
- All MNOs, however, exhibit great number of BTS opportunities in a similar range.

Sent successfully
Email sent with unlock instructions. Please check your inbox
Error sending form
There was an error processing this request. PLease try again later
To read the report please leave us your details:
An email will be sent to your address with a link to unlock it:
The information on this report is provided as of public interest by Weplan Analytics. The information on this report is provided by Weplan Analytics solely for the user's information and it is provided without warranty, guarantee or responsibility of any kind, either expressed or implied. Weplan Analytics and its employees will not be liable for any loss or damages of any nature, either direct or indirect, arising from use of the information provided in this report. Weplan Analytics is the owner of copyright in all material or information found on this report unless otherwise stated. All contents that are published in this report are safeguarded by copyright. This copyright includes the exclusive right to reproduce and distribute the contents, including reprints, translations, photographic reproductions, electronic forms (online or offline) or other reproductions of other similar kinds. Only non-commercial use may be beyond the limitations with prior written consent. Journalists are encouraged to quote information included in Weplan Analytics reports and insights as long as clear source attribution is provided. For more information, contact [email protected]

