Introduction
The polish mobile market is comprised of several MNOs and VMNOs, of which four have their own networks: Orange, Play, Plus and T-Mobile. The network situation for these MNOs acts as a trustworthy barometer of the network situation in the country. A good knowledge of the network situation also allows the customers to perform fully informed decisions. The objective of this report is to provide a summary of the network situation in Poland for these four carriers.
This report provides a quick overview of the network situation based on the following KPIs:
- Disconnection time: time that the users of an MNO have had only emergency coverage or no coverage in average, in minutes.
- 4G and 5G time: percentage of time that the users of an MNO have had 4G and, if deployed, 5G coverage (including 5G NSA and 5G SA).
- 5G penetration and usage: percentage of users that have 5G connectivity and the percentage of time that 5G is actually used.
- Network status in the Common Coverage Area: an analysis of the network status, based on the signal strength and the signal quality, for the areas where all four MNOs provide coverage.
- Call technology usage: percentage of use of each call technology by MNO. This shows which technologies are mainly used by the customers.
- Mobile network latency: percentage of customers on different latency ranks. The ranks are selected according to several performance thresholds.
Summary
The data collected by Weplan Analytics shows that, overall, all four main MNOs have a good network situation in Poland, with very similar performance among them. There are, however, some notable differences, between the MNOs.
Plus stands out as the carrier with less 5G coverage time with only 15% of the time for its 5G clients, whereas the next MNO, Orange, has a 40% of 5G coverage time. The carrier with most coverage time, Play, has a 59% of 5G coverage time. Customers of Plus also use far less VoLTE (26% of the calls) compared to its competitors, which resort to VoLTE between 46% of the time (the case of T-Mobile) and around 61% of the time (the case of Orange and Play).
Play leads the way regarding the quality of their 4G and 5G coverage area-wise and measurement wise. Although most areas are properly covered by all MNOs, the situation measurement-wise changes for Orange: only 65% of their measurements were fair or better, whereas its competitors have between 73% and 77% of their measurements with fair or better situation. Orange is also, together with Plus, the MNO that experiences more disconnection time, almost double than Play and T-Mobile.
The main key figures are the following:
- The four main MNOs (Orange, Play, Plus and T-Mobile) in Poland provide 4G or 5G coverage to their customers more than 90% of the time.
- On average, 10% of all clients for all analyzed MNOs are 5G clients. The MNO with most 5G clients is Play (13%), and the one with the least 5G clients is Orange (6%).
- Among the 5G customers, Play leads the 5G coverage time with 59% of 5G coverage. The other MNOs have between 15% (Plus) and 48% (T-Mobile) of 5G coverage time.
- At least 89% of measurements for all carriers have a latency good enough for a decent experience on every possible usage type.
Methodology
In the following pages an in-depth description of each analyzed KPI can be found, including the methodology and rationale behind them. At a more general level, the following paragraph describes the data collection methodology.
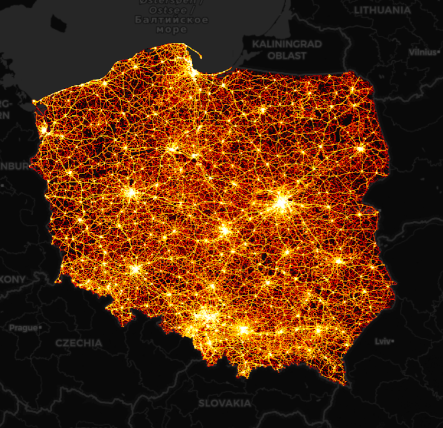
At a more general level, Weplan Analytics collects crowdsourced data from more than 200 million devices in 31 countries. For this analysis, 1,193 million measurements collected between November 2022 and January 2023 were used. The following map shows the density of measurements taken throughout the country by Weplan Analytics.
The most relevant insights can be found in the Summary section above. A detailed account of each one comprises the rest of the report below.
As the four aforementioned MNOs serve their networks to other parties (such as VMNOs, due to roaming agreements or as part of emergency coverage) the following criteria to analyze each MNO were followed:
- Play: has been filtered by the SIM PLAY.
- Plus: has been filtered by the SIM PLUS.
- Orange: has been filtered by the SIM ORANGE.
- T-Mobile: has been filtered by the SIM T-MOBILE.
It is worth notting that Orange and T-Mobile share infrastructure through the company NetworkS!, and have RAN sharing agreements in place. The MNO Play, founded in 2007 and part of the Iliad group since 2020, also has a domestic roaming agreement with Orange.
You can find more details about the methodology at this link.
Connectivity
Connectivity: Disconnection time
The following table and graphic show the disconnection time as the average daily minutes that a MNO has experienced disconnection. Disconnection time includes moments when a customer has no coverage at all (for example in underground parkings, inside elevators, so far away from a site that connection is not possible…) or moments when a customer only has emergency coverage, that is, the ability to perform only emergency calls. This disconnected time may (and, in most cases, will) be discontinuous, and is the sum of all disconnections experienced by users.
Among the polish MNOs, Play and T-Mobile experience around half the disconnection time than their competitors Orange and, especially, Plus. Although this is the added time for all customers, it is a great indicator of the coverage capability of each MNO.
Connectivity: 4G and 5G time
With the advent of the newer 5G technology older technologies such as 2G and 3G are being turned off to free frequencies. Thus, guaranteeing at least a proper 4G coverage is one of the main goals of MNOs, and for those who already have 4G sorted out, the focus turns to 5G.
Regarding 4G and 5G connectivity the situation is more even. Play leads the way with 96% of the daily usage time under advanced connectivity, followed closely by Orange and T-Mobile (tied at 94%). Plus comes last with a 90% of its time under 4G or 5G coverage. It is worth noting that Plus is the only carrier to operate in the N38 band (2600 MHz) devoting this frequency exclusively to 5G usage, whereas its competitors operate in the N1 (2100 MHz) band in 5G NSA using Dynamic Spectrum Sharing (DSS). Higher frequencies offer faster internet speed at the cost of shorter reach and less penetration in buildings. This may explain the smaller percentage of time under 4G and 5G coverage provided by Plus.
5G penetration and usage
5G rollout started in Poland in 2020 for all major MNOs. As mentioned before, Plus opted for 2600 MHz frequency for 5G, whereas its three competitors are using the 2100 MHz frequency.
The ability of a customer to use the 5G network depends on several factors. First, their device must be 5G compatible. Second, the MNO must have a 5G network. Finally, the client must contract a mobile plan that allows the 5G to be used, as not all MNOs offer full access to the 5G network as part of the regular plans. The following charts show the percentage of users by MNO that have 5G access and, for those who do, the percentage of time that they are under 5G coverage. To establish whether a user is a 5G client or not, their 5G connectivity has been checked: if they have connected to the 5G network at least once, they are considered 5G clients.
The percentage of 5G clients is similar for most carriers, with Play leading (13% of its customers are 5G clients), followed by Plus (12%) and T-Mobile (10%). Orange lags behind with only 6% of its clients being 5G clients.
There are, however, great differences in the 5G coverage of these 5G clients: Play (59% of time under 5G coverage), T-Mobile (48%) and Orange (40%) are the leaders in 5G coverage time for their 5G clients. Plus lags far behind with only 15% of time under 5G coverage for their clients.
4G and 5G network status
There are two main network performance indicators: signal strength and signal quality. Each technology has its own measurements, but five great categories can be established:
- Very Good: the performance for all network usages will be excellent.
- Good: the performance for all network usages may present occasional difficulties but is overall good.
- Fair: most network-dependent usages (such as calls or data usage) will have a decent or better performance.
- Degraded: network usage will be unstable and unreliable but allows for basic usage such as calls with acceptable quality and very slow data transfer.
- Very Degraded: network usage different from emergency calls is nearly impossible.
The MNO Play shows a remarkable percentage of both good area and degraded area compared to its competitors. It is worth reminding that Play has a national roaming agreement with Orange. However, overall, all competitors provide a good general coverage, with at least 78% of the covered area (the case of Orange and Plus) having fair or better coverage. This figure goes up to 81% in the case of T-Mobile and 85% for Play.
Measurement-wise the situation is slightly different. Play keeps being the leader in fair or better measurements (77%), with Plus and T-Mobile following with an statistical tie (73%). Orange comes last with only 65% of the measurements being fair or better, regardless of its agreements with T-Mobile.
Call type percentage
Although 2G and 3G are capable of data usage, the advent of 4G and more recently 5G technologies have relegated them to mostly call usage. The absence of 4G-based call technology ensured that 2G and 3G, as the only way to make a phone call, were still relevant. The development of VoLTE (Voice over LTE) calls during the 2010s marked the beginning of the end for these legacy technologies.
However, not all customers can benefit from VoLTE calls. For a customer to use this technology several conditions must be met:
- Their MNO must provide 4G and VoLTE.
- They must have a phone capable of performing VoLTE calls.
- They must have a phone rate that includes VoLTE calls.
- Their phone must be homologated by the MNO and the manufacturer to perform VoLTE calls.
The last condition means that a customer, without changing their phone, can have VoLTE with one MNO but lack it with a different MNO. When a customer connected to 4G without VoLTE capabilities (for any reason) tries to perform a call, a hand-off process to the 2G or 3G network takes place. This process, depending on the method applied, is called CSFB (the most common one) or SRVCC. Aside from those technologies, VoWiFi (Voice over Wi-Fi) is also used when a Wi-Fi network is available.
VoLTE usage is still increasing in the polish market. Although MNOs like Orange and Play (statistically tied with the most VoLTE usage) make more than half their calls using VoLTE, Plus still have 3G (either directly or via CSFB) as their main voice call technology. For this MNO, VoLTE calls are roughly a quarter of all calls made. For this carrier 2G (either directly or via CSFB) is also still somewhat relevant, with around 5% of all calls. It is also worth mentioning that VoWiFi calls, which are anecdotical for most MNOs in Poland, comprise around 8% of calls for T-Mobile. Regarding 2G and 3G usage T-Mobile presents a situation similar to that of Orange and Play, but presents a far larger usage of VoWiFi.
Latency status
Latency is the measurement of how much time it takes for the information to be transmitted between the user and the network. A lower latency means a faster, smoother network experience, whereas a higher latency means that the network experience will not be as good, or even unusable. This makes latency a good indicator of user experience. We have divided latency in four great groups:
- Excellent latency translates to a very smooth user experience, even with the most data-intensive usage, such as gaming or 4K streaming.
- Good latency translates to a good user experience, although gaming may not be as fluid and 4K may present occasional problems.
- Degraded latency translates to a mediocre user experience. Gaming and 4K are either uncomfortable or impossible, videochat may present noticeable lag, messaging with multimedia may take a long time to load and loading a web may be slow.
- Bad latency translates to an essentially unusable network. Only the lightest usage, such as sending messages without multimedia works decently.
All four MNOs present a similar latency situation, with at least 89% of their measurements being good or excellent. Orange, Play and T-Mobile lead this category, with an statistical tie and around 94% of their measurements being good or better. Plus comes second with 89% of their measurements being at least good. However, the differences between good and excellent measurements are remarkable. Plus only has around 61% of the measurements with excellent latency, whereas Orange, Play and T-Mobile have an statistical tie with more than 70% of the measurements being excellent .
On the lower end, all MNOs have a similar percentage of degraded measurements. However, Plus have almost double the percentage of degraded or worse measurements than its competitors.

To read the report please leave us your details:
An email will be sent to your address with a link to unlock it:
The information on this report is provided as of public interest by Weplan Analytics. The information on this report is provided by Weplan Analytics solely for the user's information and it is provided without warranty, guarantee or responsibility of any kind, either expressed or implied. Weplan Analytics and its employees will not be liable for any loss or damages of any nature, either direct or indirect, arising from use of the information provided in this report. Weplan Analytics is the owner of copyright in all material or information found on this report unless otherwise stated. All contents that are published in this report are safeguarded by copyright. This copyright includes the exclusive right to reproduce and distribute the contents, including reprints, translations, photographic reproductions, electronic forms (online or offline) or other reproductions of other similar kinds. Only non-commercial use may be beyond the limitations with prior written consent. Journalists are encouraged to quote information included in Weplan Analytics reports and insights as long as clear source attribution is provided. For more information, contact [email protected]