Introduction
The Italian mobile market comprises several operators, of which four have their own networks with nation-wide coverage: TIM, Vodafone, Windtre and Iliad. Thus, the network situation for these MNOs acts as a trustworthy barometer of the network situation in the country. A good knowledge of the network situation also allows the customers to perform fully informed decisions.
The objective of this report is to provide a summary of the network situation in Italy for these four carriers.
This report provides a quick overview of the network situation based on the following KPIs:
- Disconnection time: daily average minutes that the users from a MNO have had only emergency coverage or no coverage.
- 4G and 5G time: percentage of time that the users from a MNO have had 4G and, if available, 5G coverage (including 5G NSA and 5G SA).
- 5G penetration and usage: percentage of users that have 5G connectivity, percentage of time in 5G and percentage of active usage of 5G.
- Network status in the Common Coverage Area: an analysis of the network status, based on the signal strength and the signal quality, for the areas where all two MNOs provide coverage.
- Call type: percentage of use of each call type by operator. This shows which technologies each of their customers primarily use.
- Mobile network latency: percentage of customers on different latency ranks. The ranks are selected according to several performance thresholds.
Summary
The Italian telecommunications market is controlled by four operators with their own networks that together hold 88.5% of the market: TIM, Vodafone, Windtre and Iliad. In this competition to increase its customer base, TIM is the number 1 operator in Italy with 27,9% of the market. Very close are Vodafone, with 27.2% of the market and Windtre with 23.7%. Closing the list we find Iliad with 9.7%.
Each operator's network performance is very similar. However, there are some notable differences between them.
If we take into account the disconnection time, Iliad is the operator that remains without coverage for the least amount of time compared to its competitors.
Regarding 5G, Windtre is the operator with the highest percentage of 5G customers (16%).
On the other hand, Windtree is the operator that presents the longest 5G coverage time for its 5G clients (91%), in addition to being the one that has the longest use time of 5G coverage with 16%.
Vodafone is the operator that offers the best quality of 4G and 5G coverage, both in area and in measurements, as it offers a 80% of the area and a 74% of the measurements with a quality rated as at least fair.
If we look at the types of calls, Vodafone and TIM customers use more VoLTE (93% and 92% respectively) compared to their competitors, who use VoLTE between 66% of calls (in the case of Windtre) and 18% of calls (in the case of the Iliad).
Finally, regarding latency, in general terms, Vodafone has better latency than its competitors, with 87% of its measurements being rated as at least good latency.
The main key figures are the following:
- The four main operators (TIM, Vodafone, Windtre and Iliad) in Italy provide 4G or 5G coverage to their customers at least 93% of the time.
- 5G is still in the growth phase in the country and the number of 5G users is gradually increasing. The MNO with the most 5G clients is Windtre (16%), followed by Vodafone (14%), Iliad (12%) and TIM (9%).
- Regarding 5G coverage time for 5G clients, Windtre provides 5G coverage 91% of the time but only active use 16% of the time. They are followed by Iliad with 76% of the time with 5G coverage and 12% active use, TIM with 73% of the time with 5G coverage and 9% active use, and finally Vodafone with 50% of the time with coverage 5G and active use of 14%.
- VoLTE calls are especially relevant for TIM and Vodafone, accounting for at least 92% of total calls. In the case of Windtre and Iliad, 3G calls continue to have a great weight, accounting for 23% and 72% of calls respectively.
- At least 79% of measurements from all operators have good enough latency for a decent experience in all possible types of use.
Methodology
In the following pages an in-depth description of each analyzed KPI can be found, including the methodology and rationale behind them. At a more general level, the following paragraph describes the data collection methodology.
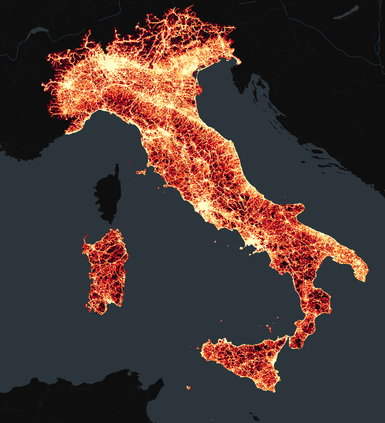
At a more general level, Weplan Analytics collects crowdsourced data from more than 300 million devices in 31 countries. For this analysis, 3000 million measurements collected between February and April 2024 were used.
The map next to this paragraph shows the density of measurements taken throughout Italia by Weplan Analytics.
As the four aforementioned MNOs serve their networks to other parties (such as VMNOs, due to roaming agreements or as part of emergency coverage) they have been filtered by the network provider reported in the SIM card.
More details about the methodology can be found here.
Connectivity
Connectivity: Daily disconnection time
The following graphic shows the disconnection time as the average number of minutes that each customer of each MNO experiences disconnections throughout the day. Disconnection time includes moments when a customer has no coverage at all (such as underground parkings, inside elevators, so far away from an antenna that connection is not possible...) or moments when a customer only has emergency coverage, that is, the ability to perform only emergency calls. This disconnected time may (and, in most cases, will) be discontinuous, and is the average of the daily disconnection time for all users.
Among Italian operators, Iliad has the shortest daily disconnection time, with only 9 minutes of daily disconnections.
Connectivity: 4G and 5G time
As a result of the development of 5G technology, old technologies such as the 2G and 3G networks are being turned off with the aim of freeing up electromagnetic spectrum to make room for more modern technologies such as 4G and 5G. This is because the frequencies are limited, so it is necessary to turn off the old ones so that the new ones can occupy those frequencies. Thus, one of the main objectives of operators is to guarantee at least adequate 4G coverage, and for those that already meet this objective, the focus turns to 5G.
Regarding 4G and 5G connectivity, it can be considered excellent work by the four operators, who maintain 93% of the time with 4G or higher coverage.
5G penetration and usage
With the arrival of 5G in Italy, Vodafone was the first operator to launch commercial 5G, in June 2019. In this initial phase, Milan, Rome, Turin, Bologna and Naples were the first cities to benefit from 5G. Two weeks later, TIM announced the launch of its 5G network, starting in Rome and Turin.
The possibility of a customer to use the 5G network depends on several factors:
- Their device must be 5G compatible.
- The MNO must have a 5G network.
- The client must contract a mobile plan that allows the 5G to be used, since not all MNOs offer full access to the 5G network as part of their regular plans.
The following charts show the percentage of users per MNO that have 5G access, and the percentage of time they are under 5G coverage. To establish whether a user is a 5G client or not, their 5G connectivity has been checked: if they have connected to the 5G network at least once, they are considered 5G clients.
Percentage of 5G users by operator
The percentage of 5G clients in Italy is still growing in the four operators analyzed in this section, with Windtre being the one with the most 5G clients (16%), followed by Vodafone (14%), Iliad (12%) and TIM (9%).
Percentage of time spent under 5G coverage for 5G clients by carrier in Italy
If we look at the time in which each user has 5G coverage available, Windtree is the clear winner with 91% of the time with 5G coverage available. It is followed by Iliad with 76%, TIM with 73% and Vodafone with 50%.
Percentage of 5G usage time for 5G users
When a user connects to the 5G network, they can do so under a Stand Alone (5G SA, pure 5G) or Non Stand Alone (5G NSA, 5G supported by the LTE network) connection.
When a user connects to the 5G NSA network, they can use only the LTE part (although they still see on their terminal that it is connected to 5G) or also the 5G part. Connecting in one way or another is mainly due to the use and capacity of the network, with the 5G network being prioritized for intensive data uses (e.g. streaming, video calls, video games, etc.) and leaving the 4G network for less intensive uses (e.g. messaging, low consumption web browsing, etc.).
The following graph shows the percentage of time that users are connected to a 5G network and are also using 5G technology.
If we emphasize the time that each user uses the available 5G, Windtre users use the 5G network 16% of the time, followed by Vodafone with 14%, Iliad with 12% and TIM with 9%.
4G and 5G network status
There are two main network performance indicators used to address the network status: signal strength and signal quality. Each technology has its own measurements, but two great categories can be established:
- Very Good: the network performance for all usages should be excellent.
- Good: the network performance for all usages may present occasional difficulties but is good overall.
- Fair: most network network-dependent usages (such as calls or data usage) will have at least a decent performance.
- Degraded: network usage may be unstable and unreliable but allows for basic usage such as calls with acceptable quality and very slow data transfer rate.
- Very Degraded: apart from emergency calls network usage is nearly impossible.
There are two ways to analyze these categories: by percentage of covered area or by percentage of measurements.
Most measurements take place in urban areas, where coverage is better.
However, it is important to note that in most countries the majority of the territory is not urban, so the percentage of area with a problematic network situation may be different from the percentage of measurements with a problematic network situation.
In general, all operators offer decent coverage in the common coverage area in Italy.
Vodafone presents the best result with 80% of the area rated as at least fair. Following Vodafone are TIM with 79%, Windtree with 72% and Iliad with 68%. Furthermore, it is worth noting that TIM is the operator with the largest area rated as at least good, with 35%.
If you look at measurements instead of area, the general situation is very similar. Vodafone is the operator with the best results, since 43% of the measurements are classified as, at least, good. It is followed by TIM with 41%, Iliad with 30% and Windtre with 27%.
Call type percentage
Although 2G and 3G technologies allow the use of data, the development of 4G and 5G has left these technologies largely relegated to use in phone calls.
However, not all customers can benefit from VoLTE calls, since in order for them to be used, the following conditions must be met:
- Your MNO must provide 4G and VoLTE.
- They must have a phone capable of making VoLTE calls and a mobile plan that includes VoLTE.
- Your phone must be approved by the MNO and the manufacturer to make VoLTE calls.
The last condition means that a customer, without changing their phone, can have VoLTE with one operator, but not have it with another. When a 4G connected customer without VoLTE capability (for any reason) attempts to make a call, a handover process to the 2G or 3G network occurs.
This process, depending on the method applied, is called CSFB (the most common) or SRVCC. In addition, there is also VoWiFi (Voice over Wi-Fi) technology, which is used when a Wi-Fi network is available.
In Italy, VoLTE technology is the most used by TIM, Vodafone and Windtre customers. It is in the Vodafone operator where we find the highest percentage of use of VoLTE calls, with 93%, followed by TIM with 92% and Windtre with 66%.
We can see that in the operators Windtre and Iliad 3G calls are still very present, with 23% and 72% respectively. With the recent announcement of the upcoming 3G network blackout by Windtre, it is very likely that the percentage of 3G calls will diminish in the future.
Latency status
Latency is the measurement of how much time it takes for the information to be transmitted between the user and the network. A lower latency means a faster, and smoother network experience, whereas a higher latency means that the network experience will not be as good, or even unusable. This makes latency a good indicator for user experience. We have divided latency in four main groups:
- Excellent latency: very smooth user experience, even with the most data-intensive usage, such as gaming or 4K streaming.
- Good latency: good user experience, although gaming may not be as fluid and 4K may present occasional problems.
- Degraded latency: mediocre user experience. Gaming and 4K are either uncomfortable or impossible, videochat may present noticeable lag, messaging with multimedia may take a long time to load and loading a web may be slow.
- Bad latency: essentially unusable network. Only the lightest usage, such as sending messages without multimedia works decently.
The four MNOs present a similar latency situation, with at least 79% of their measurements rated as good or excellent. Vodafone leads this category, with 87% of its measurements rated good or excellent. They are followed by TIM and Windtre tied with 83% each. And closing the list is Iliad, with 79% of measurements rated as good or excellent. Finally, all operators have a similar percentage of measurements with poor latency or degraded latency.

To read the report please leave us your details:
An email will be sent to your address with a link to unlock it:
The information on this report is provided as of public interest by Weplan Analytics. The information on this report is provided by Weplan Analytics solely for the user's information and it is provided without warranty, guarantee or responsibility of any kind, either expressed or implied. Weplan Analytics and its employees will not be liable for any loss or damages of any nature, either direct or indirect, arising from use of the information provided in this report. Weplan Analytics is the owner of copyright in all material or information found on this report unless otherwise stated. All contents that are published in this report are safeguarded by copyright. This copyright includes the exclusive right to reproduce and distribute the contents, including reprints, translations, photographic reproductions, electronic forms (online or offline) or other reproductions of other similar kinds. Only non-commercial use may be beyond the limitations with prior written consent. Journalists are encouraged to quote information included in Weplan Analytics reports and insights as long as clear source attribution is provided. For more information, contact [email protected]