
The busy shopping season is more than just crowded aisles and longer checkout lines - it’s a true stress test for indoor mobile networks. From mobile payments and retailer apps to messaging, social sharing, and navigation, shoppers increasingly depend on seamless connectivity inside malls. But how does the network actually perform when foot traffic peaks?
Methodology: Measuring Real User Experience
To answer this question, WePlan analyzed the indoor network experience in shopping malls around the world, measuring real user performance during the busiest shopping period and comparing it to out-of-season conditions.
Before diving into the details, it is important to note that in order to identify the true user experience, two main factors were analyzed: coverage and capacity. Coverage is the area the infrastructure covers and how far the signal reaches. In other words, typically further from the Antenna, the worse the signal is. Capacity is the ability to utilize the network for the use cases you need (text, call, open a website, etc.). If you have full bars but can’t load a web page, you have coverage but no capacity. This happens because the signal reaches you but the network is overloaded with high usage.
With these basic concepts in mind, we looked into shopping malls across the globe to identify how users were experiencing the networks. Although there are different results based on the network, for the purposes of this article, we have looked at users in a country rather than on a particular network.
Case Study: West Edmonton Mall (Canada)
We begin our shopping mall experience around the world with West Edmonton Mall, in Canada. As North America’s second-largest shopping mall, it offers a unique combination of more than 800 stores, world-class attractions, two hotels, and extensive dining options, making it a complete destination for shopping and entertainment.
To evaluate network behavior under more demanding conditions, we compare both coverage and capacity during two very different periods of the year: October 2025 and December 2025. December corresponds to the peak holiday shopping season, which brings significantly higher foot traffic to the mall.
Coverage Analysis
We begin with coverage. The following image shows RSRP (coverage) for October (left) and December (right).
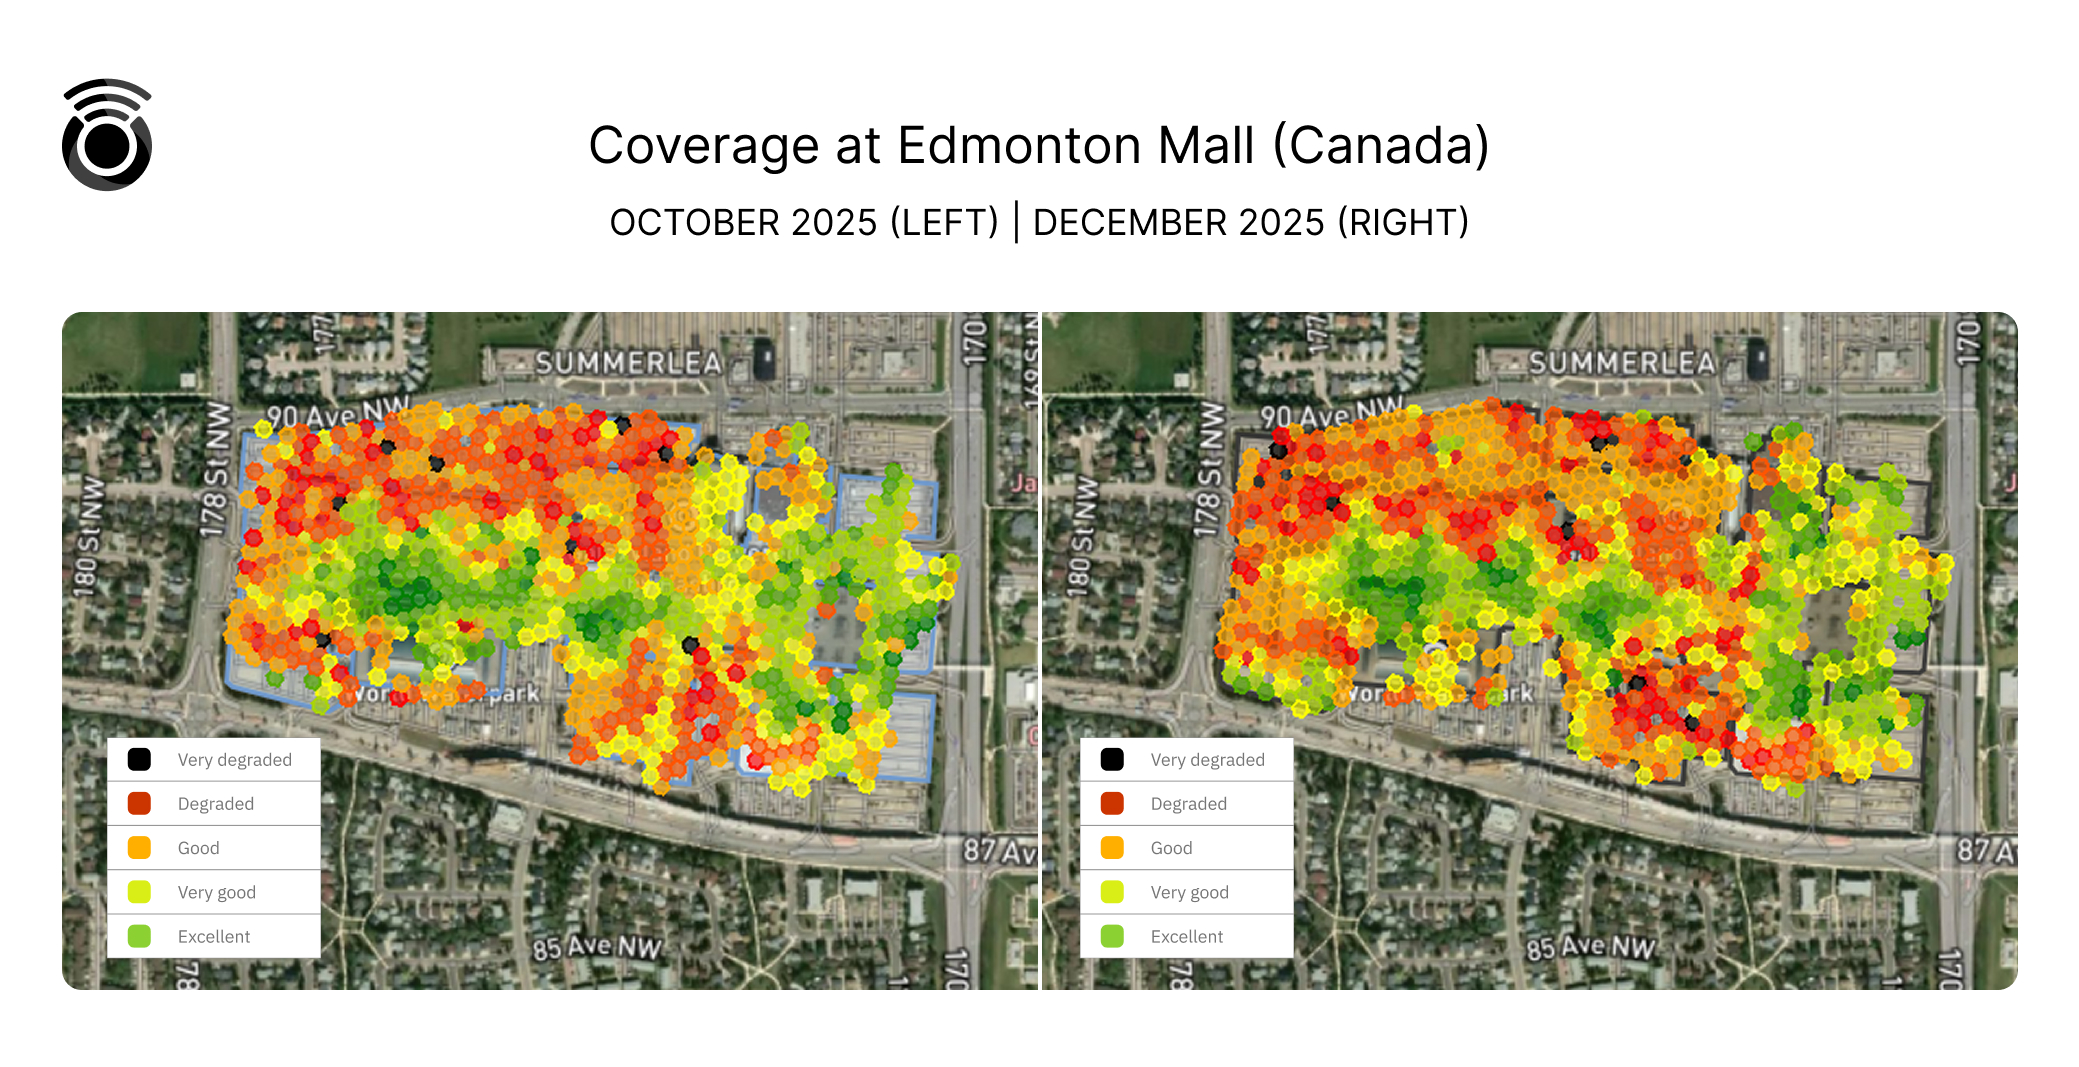
As observed, coverage remains largely unchanged between the two months. The central and eastern sections of the mall exhibit strong coverage, indicated by green areas, while the northern and western sections experience noticeable signal degradation. This consistency suggests that operators did not deploy additional infrastructure inside or around the shopping mall to enhance coverage ahead of the peak season.
Capacity Analysis
Next, we examine capacity. The following image shows RSRQ (capacity) for October (left) and December (right).
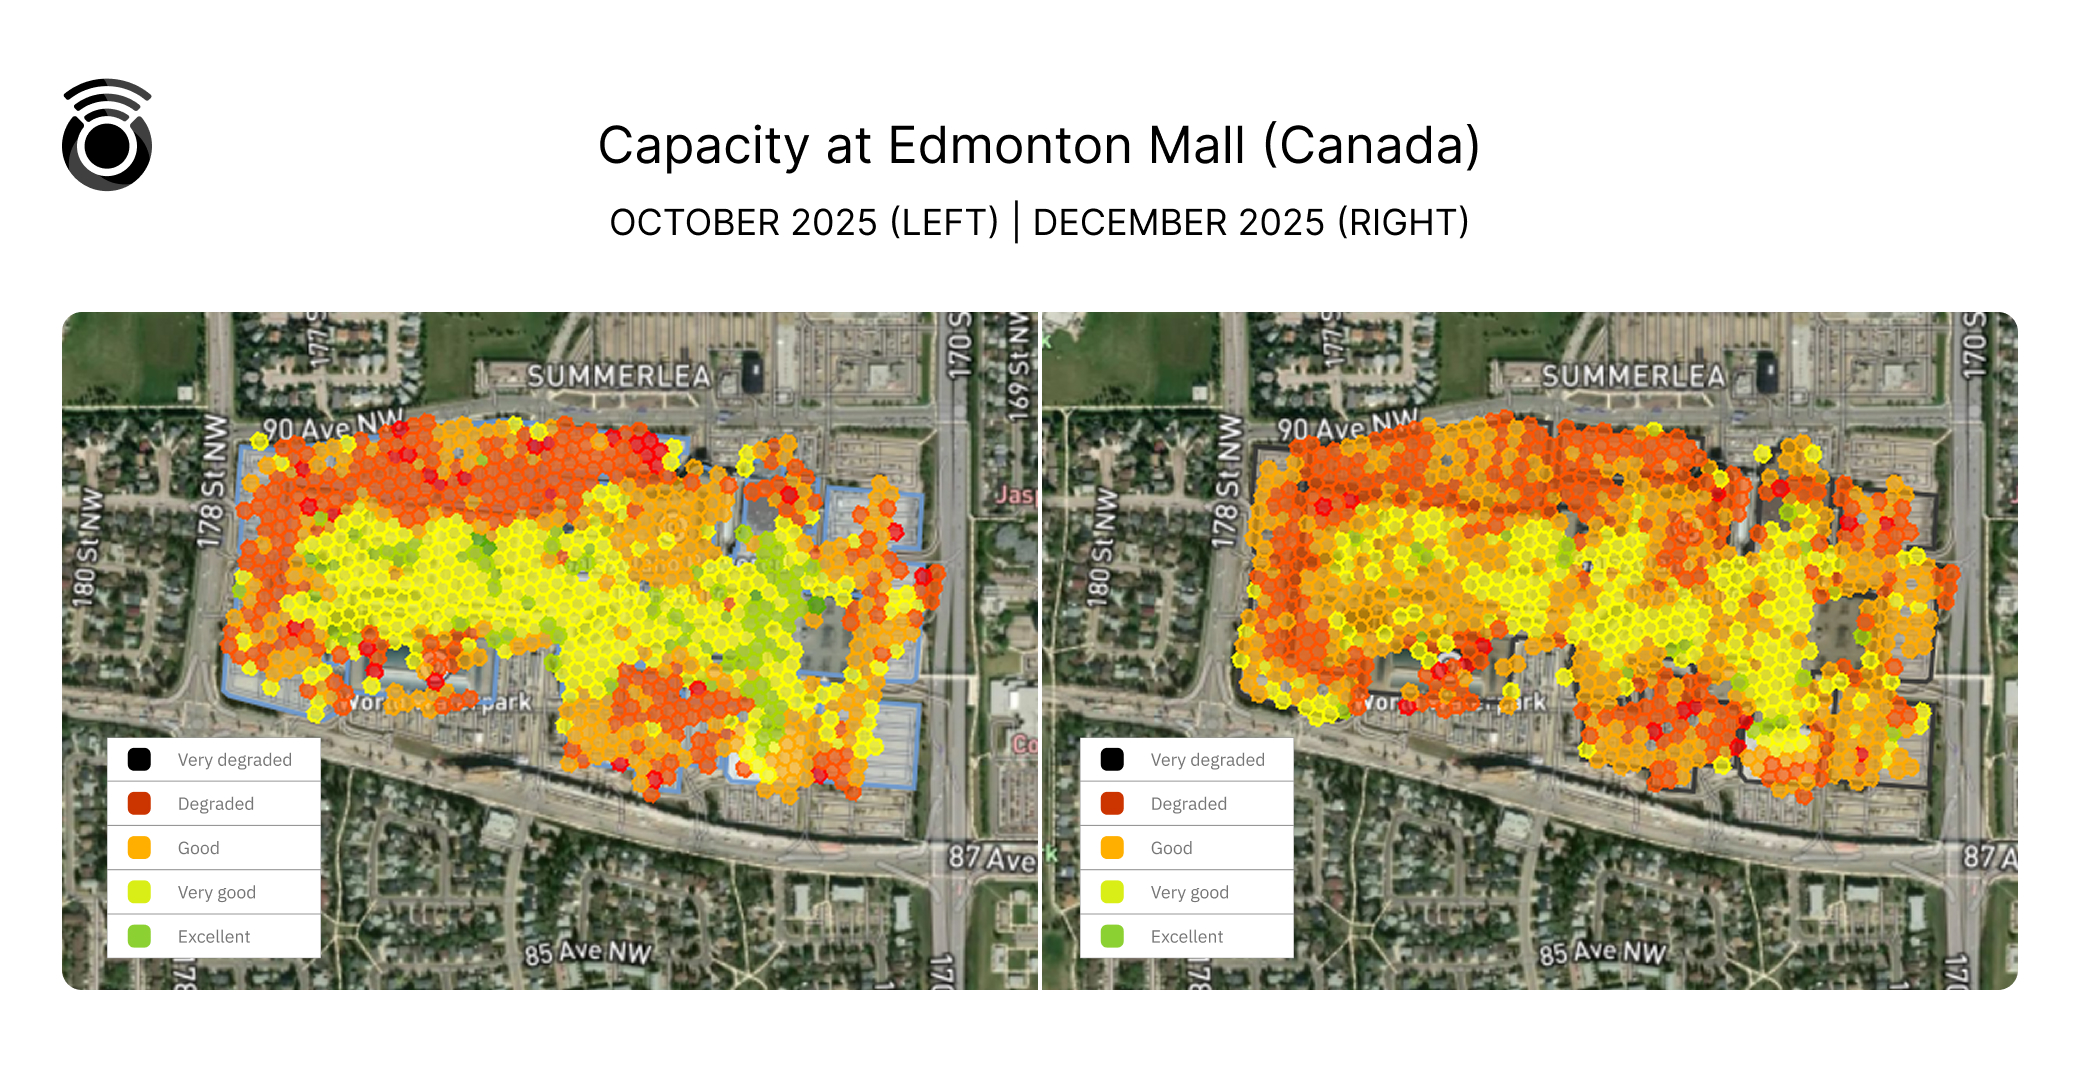
When analyzing capacity performance, a clear correlation emerges: areas with degraded coverage also exhibit reduced capacity. This indicates that limited signal reach in certain sections of the mall directly affects users’ ability to access network services. However, even in areas with good coverage, December (right) shows a noticeable degradation in signal quality, reflected by a greater presence of orange-toned areas. This degradation is driven by increased congestion resulting from higher visitor volumes during the peak shopping season, leading to reduced performance despite unchanged coverage.
Key Takeaways
The analysis of indoor mobile network performance during peak shopping periods highlights the critical role of both coverage and capacity in delivering a consistent user experience. While coverage at West Edmonton Mall remains largely stable between off-peak and peak seasons, capacity clearly degrades as foot traffic increases. This demonstrates that maintaining adequate coverage alone is not sufficient to ensure reliable indoor connectivity, as network congestion can significantly impact performance, even in areas with strong signal strength.
How WePlan Analytics Helps
This analysis is just one example of how WePlan Analytics evaluates coverage and capacity using anonymized real-user data. We help Operators, Telecom Authorities and TowerCos understand real network performance and make decisions based on actual user behavior. Discover how we turn data into actionable insights — Explore our solutions here.
This report is distributed as a public interest report by WePlan Analytics. The information in this report is provided by WePlan Analytics for information purposes only and is provided without warranty or liability of any kind, either express or implied. WePlan Analytics and its employees shall not be subject to any liability whatsoever for any loss or damage, direct or indirect, resulting from the use of the information in this document. WePlan Analytics is the copyright owner of all material and information contained in this report unless otherwise noted. The entire contents of this report are protected by copyright. This copyright includes the exclusive right of reproduction and distribution, including reprints, translations, photographic reproductions, electronic formats (online or offline) or other reproductions of a similar nature. Only non-commercial use, with prior written permission, may be considered excluded from the above limitation. Journalists and reporters are encouraged to cite information included in WePlan Analytics reports and analytics as long as the source of the information is clearly stated. For more information, contact [email protected]