
On February 8, 2026, millions of people once again gathered around their screens to experience one of the biggest events of the year: Super Bowl LX. Far beyond a sports final, the Super Bowl is a global cultural phenomenon.
Tens of thousands of attendees in the stadium and millions of viewers via streaming, television, and social media generate a digital activity peak that is difficult to replicate at any other time of the year.
But while the action unfolded on the field, another equally demanding game was being played in the background: that of the mobile network.
At WePlan Analytics, we analyzed network behavior at Levi's Stadium in Santa Clara during the hours leading up to and at the start of the event using two key indicators:
- Traffic demand
- Signal quality
The data tells a clear story of how networks respond to high user density events.
The Digital Warm-Up: Rising Traffic
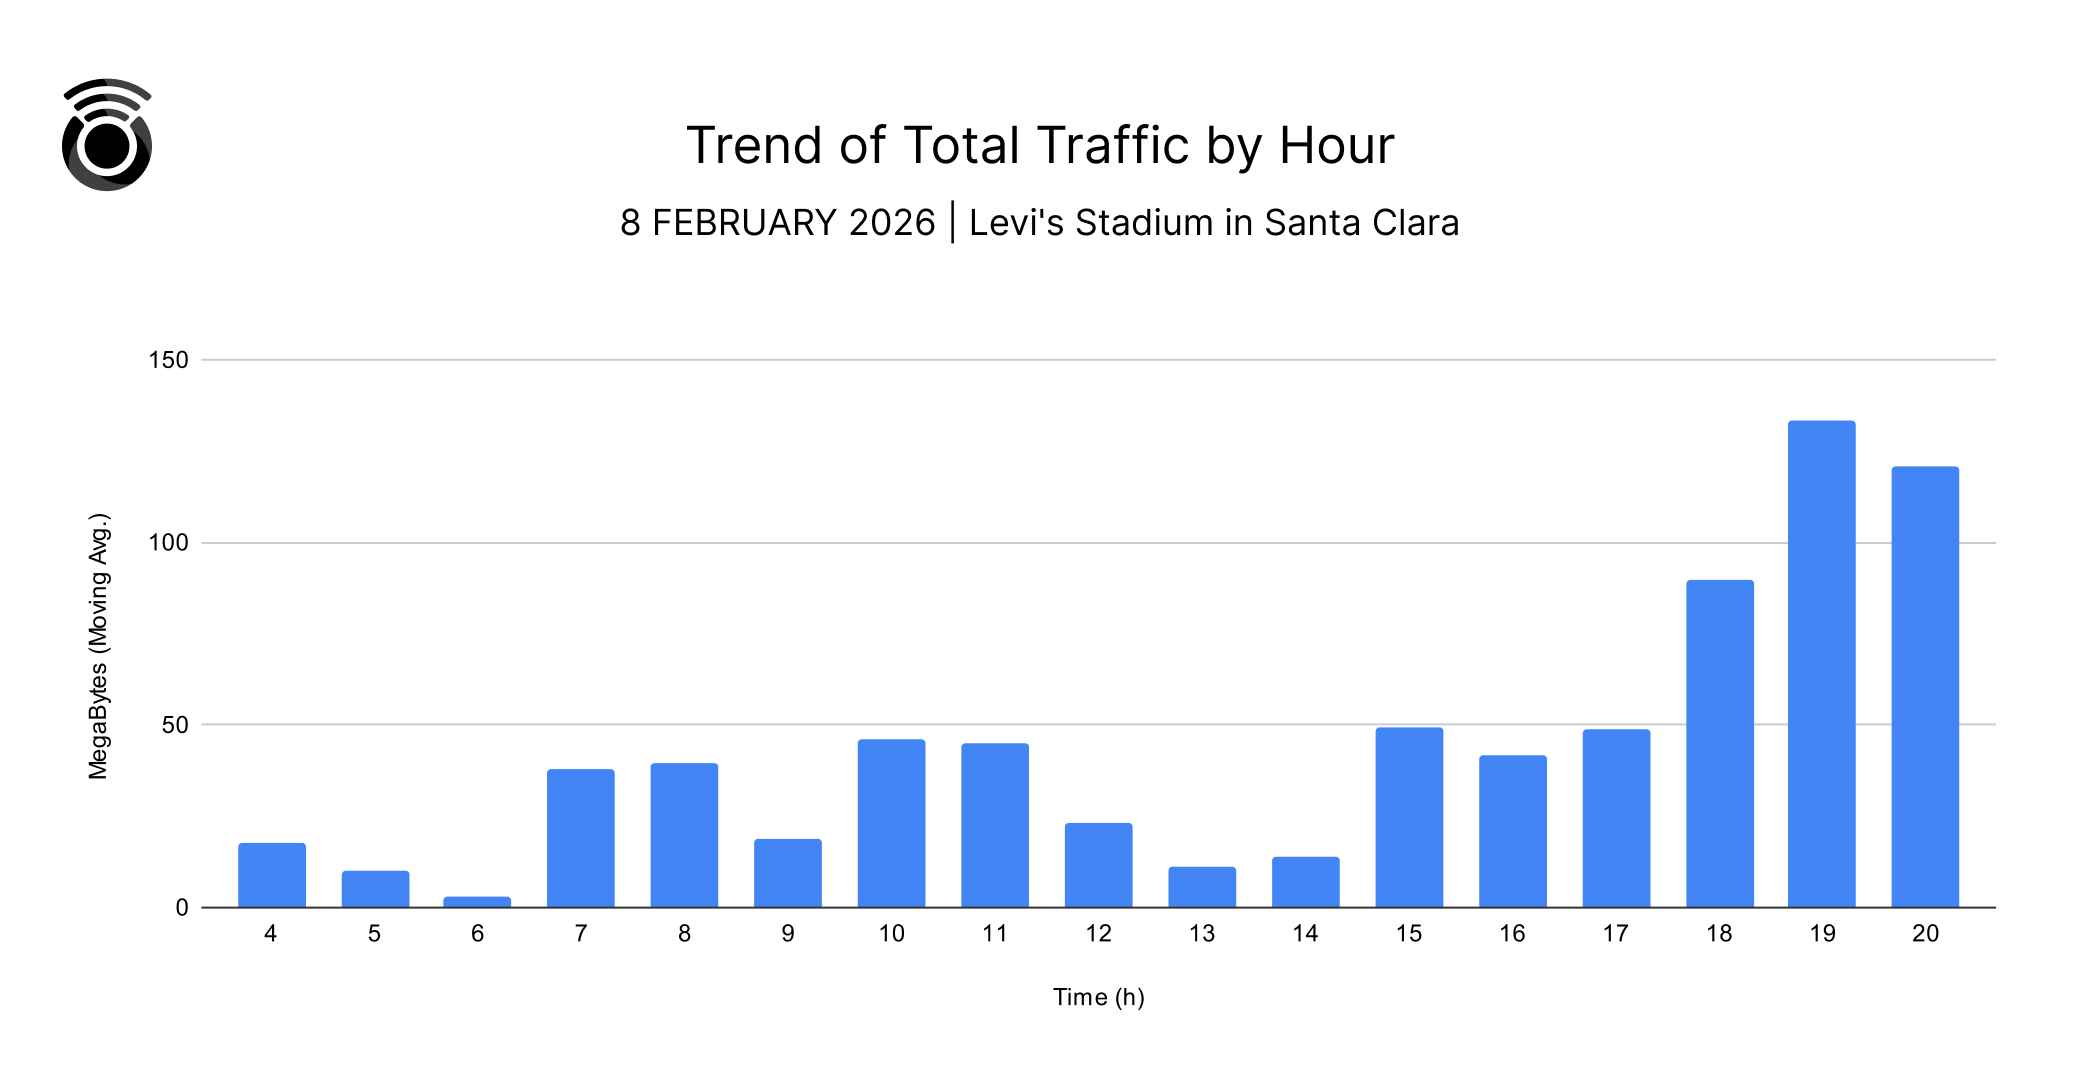
As we approached 18:30, the official kickoff time, there was a clear increase in the total volume of data carried over the network.
The Total Bytes metric reflects aggregate traffic demand, both download and upload. The progressive growth before kickoff indicates significant digital activity: streaming, real-time queries, social media engagement, and messaging.
This pattern confirms that the Super Bowl does not only concentrate television audiences, but also exerts substantial pressure on mobile infrastructure.
The game starts on the field, but digital consumption begins much earlier.
Signs of pressure: Radio quality degradation
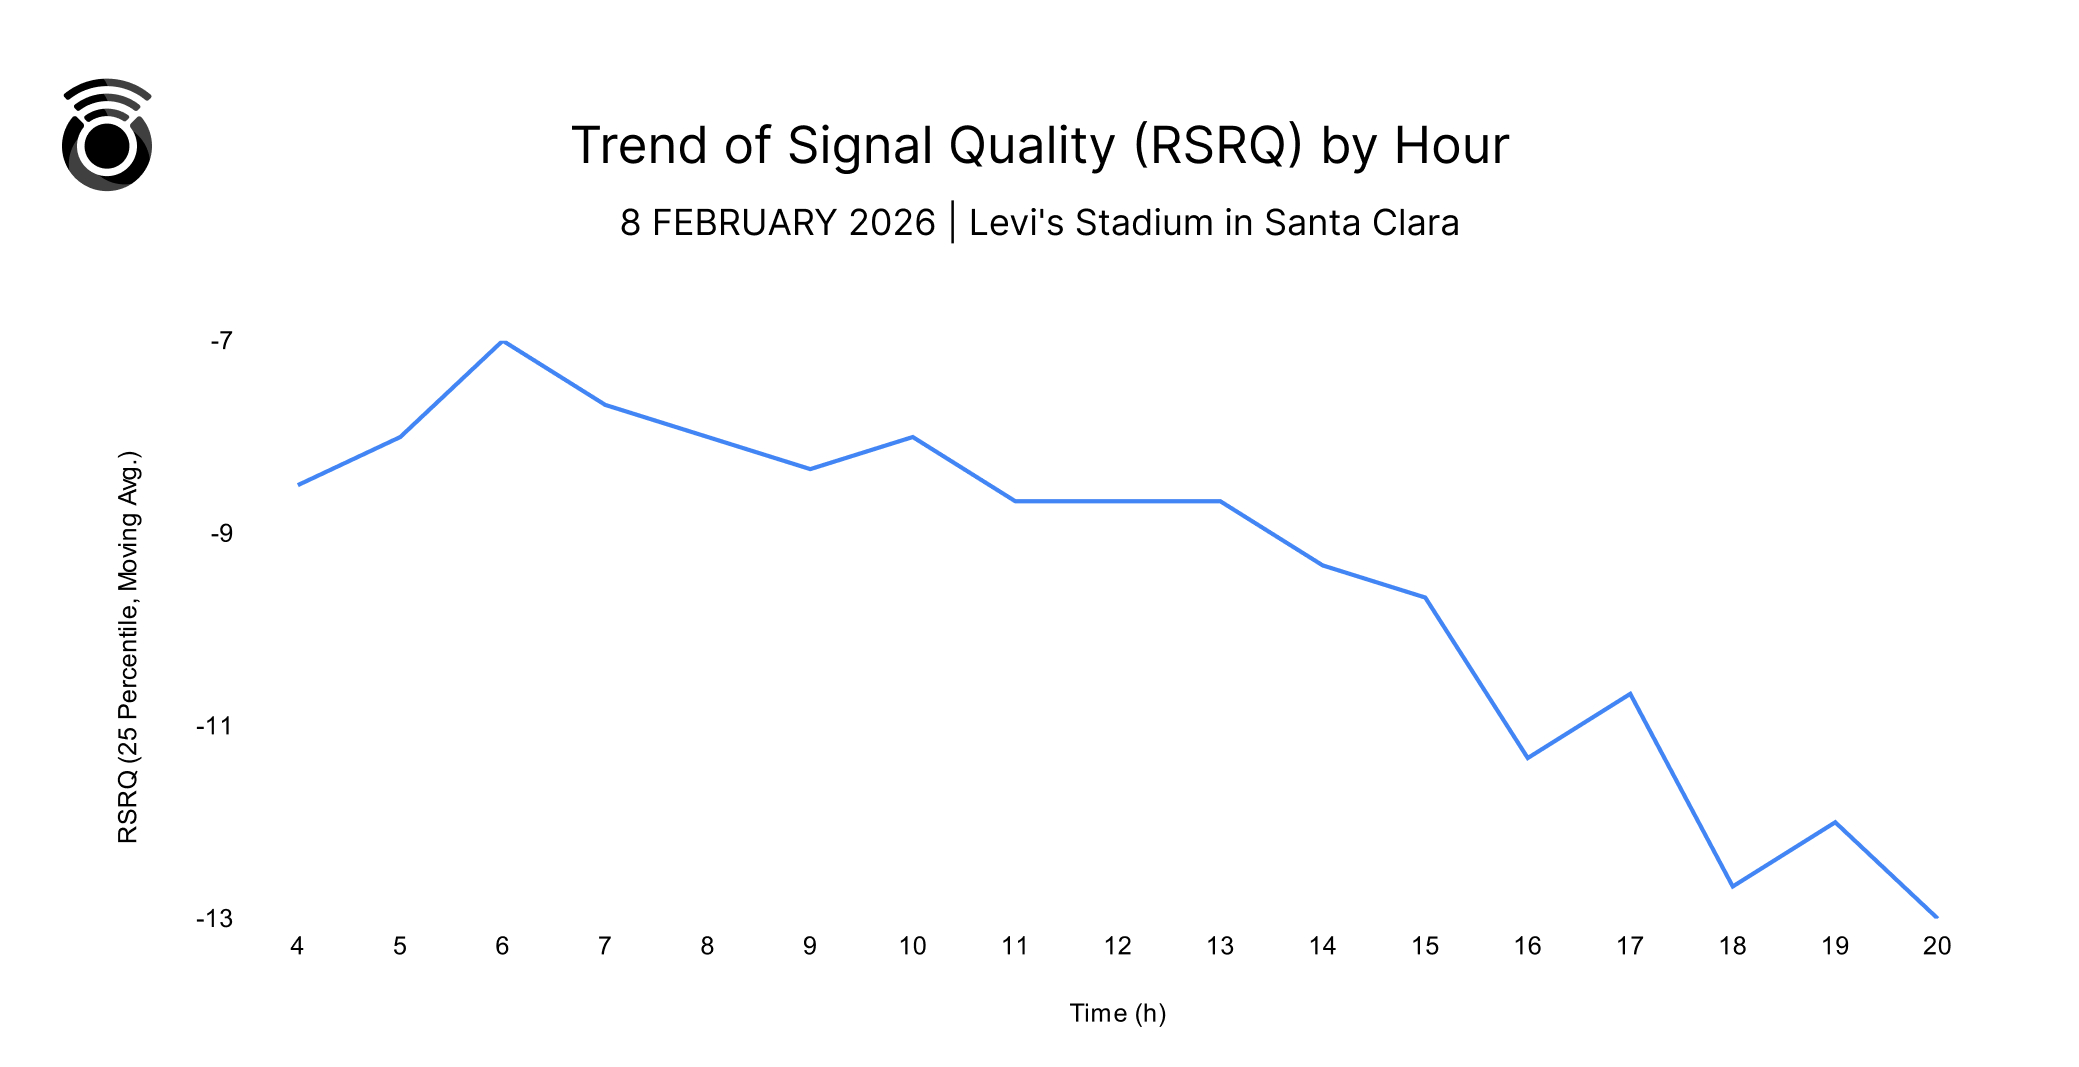
During the hours leading up to and at the start of the event, the RSRQ indicator showed a downward trend, reflecting growing pressure on radio resources as the concentration of active users increased.
However, a key insight confirms that the network was well-prepared: the 25th percentile of RSRQ remained above -15 dB throughout the event. This means that even the 25 % of users with the weakest signal experienced adequate quality, suggesting that the infrastructure was able to absorb the event load and ensure a stable experience for the vast majority of users.
Taken together, the combination of rising traffic and RSRQ stability at the 25th percentile demonstrates that, although the network was under pressure, prior planning and deployed capacity were effective in maintaining solid performance during Super Bowl 2026.
What Super Bowl 2026 teaches us
The Super Bowl is not just a sporting event; it is a natural stress test for mobile networks.
The combined analysis of traffic and radio quality goes beyond isolated metrics, helping us understand the real impact on end-user experience.
Today, the event experience depends not only on the score. It also depends on the network’s ability to sustain millions of shared moments in real time.
Beyond metrics: Decisions based on reality
This Super Bowl 2026 analysis is an example of how WePlan Analytics evaluates real traffic demand and network behavior using anonymized data from real users.
By analyzing consumption and quality metrics together, we help Operators, Telecom Authorities, and TowerCos understand how their infrastructure responds to demand peaks and high-density events.
We turn real user experience data into actionable insights that allow stakeholders to:
- Identify early signs of congestion
- Evaluate network resilience during massive events
- Optimize capacity planning
- Make decisions based on real usage, not theoretical estimates
Discover how we transform data into strategic decisions — Explore our solutions here.
This report is distributed as a public interest report by WePlan Analytics. The information in this report is provided by WePlan Analytics for information purposes only and is provided without warranty or liability of any kind, either express or implied. WePlan Analytics and its employees shall not be subject to any liability whatsoever for any loss or damage, direct or indirect, resulting from the use of the information in this document. WePlan Analytics is the copyright owner of all material and information contained in this report unless otherwise noted. The entire contents of this report are protected by copyright. This copyright includes the exclusive right of reproduction and distribution, including reprints, translations, photographic reproductions, electronic formats (online or offline) or other reproductions of a similar nature. Only non-commercial use, with prior written permission, may be considered excluded from the above limitation. Journalists and reporters are encouraged to cite information included in WePlan Analytics reports and analytics as long as the source of the information is clearly stated. For more information, contact [email protected]